by Calculated Risk on 1/24/2018 10:14:00 AM
Wednesday, January 24, 2018
NAR: "Existing-Home Sales Fade in December; 2017 Sales Up 1.1 Percent"
From the NAR: Existing-Home Sales Fade in December; 2017 Sales Up 1.1 Percent
xisting-home sales subsided in most of the country in December, but 2017 as a whole edged up 1.1 percent and ended up being the best year for sales in 11 years, according to the National Association of Realtors®.
Total existing-home sales, which are completed transactions that include single-family homes, townhomes, condominiums and co-ops, increased 1.1 percent in 2017 to a 5.51 million sales pace and surpassed 2016 (5.45 million) as the highest since 2006 (6.48 million).
In December, existing-home sales slipped 3.6 percent to a seasonally adjusted annual rate of 5.57 million from a downwardly revised 5.78 million in November. After last month’s decline, sales are still 1.1 percent above a year ago.
...
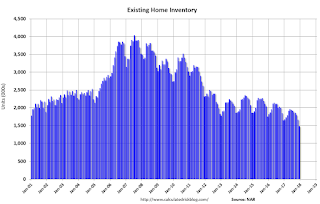
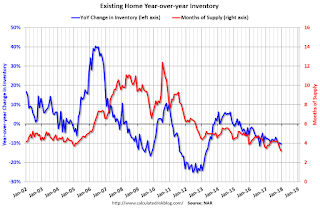
Total housing inventory at the end of December dropped 11.4 percent to 1.48 million existing homes available for sale, and is now 10.3 percent lower than a year ago (1.65 million) and has fallen year-over-year for 31 consecutive months. Unsold inventory is at a 3.2-month supply at the current sales pace, which is down from 3.6 months a year ago and is the lowest level since NAR began tracking in 1999.
emphasis added
 Click on graph for larger image.
This graph shows existing home sales, on a Seasonally Adjusted Annual Rate (SAAR) basis since 1993.
Sales in December (5.57 million SAAR) were 3.6% higher than last month, and were 1.1% above the December 2016 rate.
The second graph shows nationwide inventory for existing homes.
 According to the NAR, inventory decreased to 1.48 million in December from 1.67 million in November. Headline inventory is not seasonally adjusted, and inventory usually decreases to the seasonal lows in December and January, and peaks in mid-to-late summer.
The last graph shows the year-over-year (YoY) change in reported existing home inventory and months-of-supply. Since inventory is not seasonally adjusted, it really helps to look at the YoY change. Note: Months-of-supply is based on the seasonally adjusted sales and not seasonally adjusted inventory.
 Inventory decreased 10.3% year-over-year in December compared to December 2016.
 Months of supply was at 3.2 months in December.
As expected by CR readers, sales were below the consensus view. For existing home sales, a key number is inventory - and inventory is still low. I'll have more later ...
AIA: "Architecture billings end year on positive note"
by Calculated Risk on 1/24/2018 09:19:00 AM
Note: This index is a leading indicator primarily for new Commercial Real Estate (CRE) investment.
From the AIA: Architecture billings end year on positive note
The Architecture Billings Index (ABI) concluded the year in positive terrain, with the December reading capping off three straight months of growth in design billings. The American Institute of Architects (AIA) reported the December ABI score was 52.9, down from a score of 55.0 in the previous month. This score still reflects an increase in design services provided by U.S. architecture firms (any score above 50 indicates an increase in billings). The new projects inquiry index was 61.9, up from a reading of 61.1 the previous month, while the new design contracts index decreased slightly from 53.2 to 52.7.
“Overall, 2017 turned out to be a strong year for architecture firms. All but two months saw ABI scores in positive territory,” said AIA Chief Economist, Kermit Baker, Hon. AIA, PhD. “Additionally, the overall strength of the fourth quarter lays a good foundation for healthy growth in construction activity in 2018.”
...
• Regional averages: South (56.3), West (53.0), Midwest (52.9), Northeast (49.4)
• Sector index breakdown: multi-family residential (55.4), commercial / industrial (54.8), institutional (51.2), mixed practice (50.4)
emphasis added
 Click on graph for larger image.
This graph shows the Architecture Billings Index since 1996. The index was at 52.9 in December, down from 55.0 in November. Anything above 50 indicates expansion in demand for architects' services.
Note: This includes commercial and industrial facilities like hotels and office buildings, multi-family residential, as well as schools, hospitals and other institutions.
According to the AIA, there is an "approximate nine to twelve month lag time between architecture billings and construction spending" on non-residential construction. This index was positive in 10 of the last 12 months, suggesting a further increase in CRE investment into 2018.
MBA: Mortgage Applications Increase in Latest Weekly Survey
by Calculated Risk on 1/24/2018 07:00:00 AM
From the MBA: Mortgage Applications Increase in Latest MBA Weekly Survey
Mortgage applications increased 4.5 percent from one week earlier, according to data from the Mortgage Bankers Association’s (MBA) Weekly Mortgage Applications Survey for the week ending January 19, 2018. This week’s results included an adjustment for the MLK Day holiday.
... The Refinance Index increased 1 percent from the previous week. The seasonally adjusted Purchase Index increased 6 percent from one week earlier to its highest level since April 2010. The unadjusted Purchase Index increased 2 percent compared with the previous week and was 7 percent higher than the same week one year ago. ...
The average contract interest rate for 30-year fixed-rate mortgages with conforming loan balances ($453,100 or less) increased to its highest level since March 2017, 4.36 percent, from 4.33 percent, with points remaining unchanged at 0.54 (including the origination fee) for 80 percent loan-to-value ratio (LTV) loans.
emphasis added
 Click on graph for larger image.
The first graph shows the refinance index since 1990.
Refinance activity will not pick up significantly unless mortgage rates fall well below 4%.
 The second graph shows the MBA mortgage purchase index.
 The weekly index is at the highest level since April 2010 (The 4-week average is still below the peak of last year).
According to the MBA, purchase activity is up 7% year-over-year.
Tuesday, January 23, 2018
Wednesday: Existing Home Sales
by Calculated Risk on 1/23/2018 07:09:00 PM
From Matthew Graham at Mortgage News Daily: Small Reprieve For Recent Rate Spike
Mortgage rates finally managed to move lower in a small but meaningful way today--something they haven't done in more than 2 weeks! ... While it is indeed bigger than recent examples, many prospective borrowers will find it underwhelming. In isolated cases, it may get a loan quote down to the next .125% of a percent lower, but most quotes will simply have slightly lower upfront costs (while the rate itself remains unchanged). Looked at another way, we could say apart from yesterday, today's rates are the highest in more than 9 months. [30YR FIXED - 4.25%]Wednesday:
emphasis added
• At 7:00 AM ET, The Mortgage Bankers Association (MBA) will release the results for the mortgage purchase applications index.
• At 9:00 AM, FHFA House Price Index for November 2017. This was originally a GSE only repeat sales, however there is also an expanded index.
• At 10:00 AM, Existing Home Sales for December from the National Association of Realtors (NAR). The consensus is for 5.75 million SAAR, down from 5.81 million in November. Housing economist Tom Lawler expects the NAR to report sales of 5.66 million SAAR for December.
• During the day, The AIA's Architecture Billings Index for December (a leading indicator for commercial real estate).
Chemical Activity Barometer Increased in January
by Calculated Risk on 1/23/2018 02:29:00 PM
Note: This appears to be a leading indicator for industrial production.
From the American Chemistry Council: Business, Economic Activity Show No Signs of Winter Freeze as 2018 Gets off to Robust Start
The Chemical Activity Barometer (CAB), a leading economic indicator created by the American Chemistry Council (ACC), expanded 0.5 percent in January on a three-month moving average (3MMA) basis and 0.7 percent on an unadjusted basis. This follows an upwardly revised 3MMA gain of 0.7 percent in December and 0.5 percent in November. The CAB is up 4.0 percent compared to a year earlier, indicating a robust economy well into the third-quarter of 2018.
...
Applying the CAB back to 1912, it has been shown to provide a lead of two to fourteen months, with an average lead of eight months at cycle peaks as determined by the National Bureau of Economic Research. The median lead was also eight months. At business cycle troughs, the CAB leads by one to seven months, with an average lead of four months. The median lead was three months. The CAB is rebased to the average lead (in months) of an average 100 in the base year (the year 2012 was used) of a reference time series. The latter is the Federal Reserve’s Industrial Production Index.
emphasis added
 Click on graph for larger image.
This graph shows the year-over-year change in the 3-month moving average for the Chemical Activity Barometer compared to Industrial Production. It does appear that CAB (red) generally leads Industrial Production (blue).
The year-over-year increase in the CAB has been solid over the last year, suggesting further gains in industrial production in 2018.
Earlier: "Fifth District Manufacturing Firms Reported Slowing Growth in January"
by Calculated Risk on 1/23/2018 11:54:00 AM
Earlier from the Richmond Fed: Fifth District Manufacturing Firms Reported Slowing Growth in January
According to the latest survey by the Federal Reserve Bank of Richmond, Fifth District manufacturing firms saw slower growth in January, even as each of the expansion metrics remained positive. The composite index moved down from 20 to 14. This decrease resulted from a decline in the metrics for both shipments and employment [declined from 20 to 10]. The third component, new orders, held steady. However, manufacturing firms saw an increase in backlogs in January, after a decrease in December, as the index rose from −4 to 5. Firms reported that they expect growth to strengthen in the coming months.CR note: All of the regions that have reported so far for January have shown slowing, but still solid, growth.
emphasis added
BLS: Unemployment Rates Lower in 6 states in December; California, Hawaii and Mississippi at New Series Lows
by Calculated Risk on 1/23/2018 10:18:00 AM
From the BLS: Regional and State Employment and Unemployment Summary
Unemployment rates were lower in December in 6 states and the District of Columbia, higher in 1 state, and stable in 43 states, the U.S. Bureau of Labor Statistics reported today. Twenty-five states had jobless rate decreases from a year earlier, 2 states had increases, and 23 states and the District had little or no change. The national unemployment rate was unchanged from November at 4.1 percent but was 0.6 percentage point lower than in December 2016.
...
Hawaii had the lowest unemployment rate in December, 2.0 percent. The rates in California (4.3 percent), Hawaii (2.0 percent), and Mississippi (4.6 percent) set new series lows. (All state series begin in 1976.) Alaska had the highest jobless rate, 7.3 percent.
emphasis added
 Click on graph for larger image.
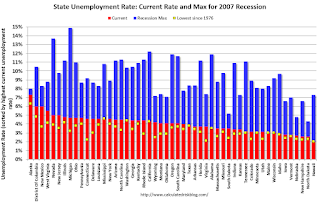
This graph shows the current unemployment rate for each state (red), and the max during the recession (blue). All states are well below the maximum unemployment rate for the recession.
The size of the blue bar indicates the amount of improvement. The yellow squares are the lowest unemployment rate per state since 1976.
Fourteen states have reached new all time lows since the end of the 2007 recession. These fourteen states are: Alabama, Arkansas, California, Colorado, Hawaii, Idaho, Maine, Mississippi, North Dakota, Oregon, Tennessee, Texas, Washington, and Wisconsin.
The states are ranked by the highest current unemployment rate. Alaska, at 7.3%, had the highest state unemployment rate.
 The second graph shows the number of states (and D.C.) with unemployment rates at or above certain levels since January 2006. At the worst of the employment recession, there were 11 states with an unemployment rate at or above 11% (red).
Currently one state has an unemployment rate at or above 7% (light blue); Only two states and D.C. are at or above 6% (dark blue). The states are Alaska (7.3%) and New Mexico (6.0%). D.C. is at 6.0%.
Black Knight: National Mortgage Delinquency Rate increased in December due to Hurricanes
by Calculated Risk on 1/23/2018 09:22:00 AM
From Black Knight: Black Knight’s First Look at December 2017 Mortgage Data: 90-Day Delinquencies Jump Again as Hurricane Fallout Continues
• An additional 60,000 mortgages became 90 days delinquent in December, driven by both continued hurricane-related fallout as well as upward seasonal and calendar-related pressuresAccording to Black Knight's First Look report for December, the percent of loans delinquent increased 3.5% in December compared to November, and increased 6.5% year-over-year.
• There are now 142,700 90+ days delinquent loans attributed to Hurricanes Harvey and Irma, representing 20 percent of all severely delinquent loans nationwide
• 102,500 severely delinquent loans in affected areas of Florida and Georgia can be attributed to Hurricane Irma, while another 40,200 are the result of Hurricane Harvey in southeastern Texas
• The overall delinquency rate (representing loans 30 or more days past due, but not yet in active foreclosure) also rose another 3.47 percent to its highest level since early 2016
• December’s 6.54 percent year-over-year rise marked the fourth consecutive month of annual increases to the national delinquency rate
• The inventory of loans in active foreclosure continues to improve, falling 152,000 from last year for a 32 percent annual decline
The percent of loans in the foreclosure process declined 2.2% in December and were down 32% over the last year.
Black Knight reported the U.S. mortgage delinquency rate (loans 30 or more days past due, but not in foreclosure) was 4.71% in December, up from 4.55% in November.
The percent of loans in the foreclosure process declined in December to 0.65%.
The number of delinquent properties, but not in foreclosure, is up 44,000 properties year-over-year, and the number of properties in the foreclosure process is down 152,000 properties year-over-year.
| Black Knight: Percent Loans Delinquent and in Foreclosure Process | ||||
|---|---|---|---|---|
| Dec 2017 | Nov 2017 | Dec 2016 | Dec 2015 | |
| Delinquent | 4.71% | 4.55% | 4.42% | 4.78% |
| In Foreclosure | 0.65% | 0.66% | 0.95% | 1.37% |
| Number of properties: | ||||
| Number of properties that are delinquent, but not in foreclosure: | 2,412,000 | 2,324,000 | 2,248,000 | 2,408,000 |
| Number of properties in foreclosure pre-sale inventory: | 331,000 | 337,000 | 483,000 | 689,000 |
| Total Properties | 2,743,000 | 2,661,000 | 2,731,000 | 3,097,000 |
Monday, January 22, 2018
"Mortgage Rates Set Another 9-Month High"
by Calculated Risk on 1/22/2018 05:05:00 PM
From Matthew Graham at Mortgage News Daily: Mortgage Rates Set Another 9-Month High
Mortgage rates pushed up to yet another 9-month high today--something that's become all too common in the past few weeks. Just as troubling is the fact that 10yr Treasury yields--the bigger, more important neighbor that shares the street with mortgage rates--are operating at their highest levels since early 2014. Mortgage rates aren't directly tied to Treasury yields, but big momentum in Treasuries tends to spill over. [30YR FIXED - 4.25-4.375%]Tuesday:
emphasis added
• At 10:00 AM ET, Richmond Fed Survey of Manufacturing Activity for January.
• Also at 10:00 AM, State Employment and Unemployment (Monthly) for December 2017 (might be delayed)
Bloomberg: "This Rare Bear Who Called the Crash Warns Housing Is Too Hot Again"
by Calculated Risk on 1/22/2018 01:54:00 PM
This article from Prashant Gopal at Bloomberg quotes me. But I'm NOT warning that "Housing is too hot again" (that is someone else). This Rare Bear Who Called the Crash Warns Housing Is Too Hot Again
Stack, 66, who manages $1.3 billion for people with a high net worth, predicted the housing crash in 2005, just before prices reached their peak. Now, from his perch in Whitefish, Montana, he says his “Housing Bubble Bellwether Barometer” of homebuilder and mortgage company stocks, which jumped 80 percent in the past year, once again is flashing red.Prices might be a little too high in some areas, but nothing like in 2005. And we aren't seeing the speculation and loose lending that was rampant in 2005.
“It is 2005 all over again in terms of the valuation extreme, the psychological excess and the denial,” said Stack, whose fireproof files of newspaper articles on bear markets date back to 1929. “People don’t believe housing is in a bubble and don’t want to hear talk about prices being a little bit bubblish.”


