 RSS Feed
 by Calculated Risk on 10/13/2017 09:18:00 AM
Friday, October 13, 2017
Cost of Living Adjustment increases 2.0% in 2018, Contribution Base increased to $128,700
With the release of the CPI report this morning, we now know the Cost of Living Adjustment (COLA), and the contribution base for 2018.
From Social Security: Social Security Announces 2.0 Percent Benefit Increase for 2018
Monthly Social Security and Supplemental Security Income (SSI) benefits for more than 66 million Americans will increase 2.0 percent in 2018, the Social Security Administration announced today.Currently CPI-W is the index that is used to calculate the Cost-Of-Living Adjustments (COLA). Here is a discussion from Social Security on the current calculation (2.0% increase) and a list of previous Cost-of-Living Adjustments.
The 2.0 percent cost-of-living adjustment (COLA) will begin with benefits payable to more than 61 million Social Security beneficiaries in January 2018. Increased payments to more than 8 million SSI beneficiaries will begin on December 29, 2017. (Note: some people receive both Social Security and SSI benefits) The Social Security Act ties the annual COLA to the increase in the Consumer Price Index as determined by the Department of Labor’s Bureau of Labor Statistics.
Some other adjustments that take effect in January of each year are based on the increase in average wages. Based on that increase, the maximum amount of earnings subject to the Social Security tax (taxable maximum) will increase to $128,700 from $127,200. Of the estimated 175 million workers who will pay Social Security taxes in 2018, about 12 million will pay more because of the increase in the taxable maximum.
The contribution and benefit base will be $128,700 in 2018.
The National Average Wage Index increased to $48,664.73 in 2016, up 1.2% from $48,098.63 in 2015 (used to calculate contribution base).
Retail Sales increased 1.6% in September
by Calculated Risk on 10/13/2017 08:38:00 AM
On a monthly basis, retail sales increased 1.6 percent from August to September(seasonally adjusted), and sales were up 4.4 percent from September 2016.
From the Census Bureau report:
Advance estimates of U.S. retail and food services sales for September 2017, adjusted for seasonal variation and holiday and trading-day differences, but not for price changes, were $483.9 billion, an increase of 1.6 percent from the previous month, and 4.4 percent above September 2016. ... The July 2017 to August 2017 percent change was revised from down 0.2 percent to down 0.1 percent.
 Click on graph for larger image.
This graph shows retail sales since 1992. This is monthly retail sales and food service, seasonally adjusted (total and ex-gasoline).
Retail sales ex-gasoline were up 1.2% in September.
The second graph shows the year-over-year change in retail sales and food service (ex-gasoline) since 1993.
 Retail and Food service sales, ex-gasoline, increased by 3.8% on a YoY basis.
The increase in September was slightly below expectations, however sales in July and August were revised up.
Thursday, October 12, 2017
Friday: Retail Sales, CPI and 2018 COLA
by Calculated Risk on 10/12/2017 08:18:00 PM
Friday:
• At 8:30 AM ET, The Consumer Price Index for September from the BLS. The consensus is for a 0.6% increase in CPI, and a 0.2% increase in core CPI. Note: The 2018 Cost-Of-Living Adjustments and Maximum Contribution Base will be announced tomorrow. COLA will probably be around 2%.
• Also at 8:30 AM, Retail sales for September will be released. The consensus is for a 1.9% increase in retail sales.
• At 10:00 AM, Manufacturing and Trade: Inventories and Sales (business inventories) report for August. The consensus is for a 0.6% increase in inventories.
• Also at 10:00 AM, University of Michigan's Consumer sentiment index (preliminary for October). The consensus is for a reading of 95.5, up from 95.1 in September.
LA area Port Traffic: Imports increased, Exports decreased in September
by Calculated Risk on 10/12/2017 03:40:00 PM
Container traffic gives us an idea about the volume of goods being exported and imported - and usually some hints about the trade report since LA area ports handle about 40% of the nation's container port traffic.
The following graphs are for inbound and outbound traffic at the ports of Los Angeles and Long Beach in TEUs (TEUs: 20-foot equivalent units or 20-foot-long cargo container).
To remove the strong seasonal component for inbound traffic, the first graph shows the rolling 12 month average.
 Click on graph for larger image.
On a rolling 12 month basis, inbound traffic was up 1.0% compared to the rolling 12 months ending in August. Outbound traffic was down 0.3% compared to the rolling 12 months ending in August.
The 2nd graph is the monthly data (with a strong seasonal pattern for imports).
 Usually imports peak in the July to October period as retailers import goods for the Christmas holiday, and then decline sharply and bottom in February or March depending on the timing of the Chinese New Year.
This was the highest level of imports ever for the month of September - following record imports in July and August - suggesting the retailers are optimistic about the Christmas Holiday shopping season.
In general imports have been increasing, and exports are mostly moving sideways to down recently.
Hotel Occupancy Rate increases YoY, Just behind Record Year
by Calculated Risk on 10/12/2017 02:50:00 PM
From HotelNewsNow.com: STR: US hotel results for week ending 7 October
The U.S. hotel industry reported positive year-over-year results in the three key performance metrics during the week of 1-7 October 2017, according to data from STR.The following graph shows the seasonal pattern for the hotel occupancy rate using the four week average.
In comparison with the week of 2-8 October 2016, the industry recorded the following:
• Occupancy: +0.9% to 71.4%
• Average daily rate (ADR): +2.0% to US$130.92
• Revenue per available room (RevPAR): +3.0% to US$93.51
Among the Top 25 Markets, Houston, Texas, once again reported the largest year-over-year increases in occupancy (+45.0% to 85.9%) and RevPAR (+66.0% to US$99.25). With a spike in post-Hurricane Harvey demand, Houston also posted the second-largest ADR increase (+14.5% to US$115.51).
emphasis added
 The red line is for 2017, dash light blue is 2016, dashed orange is 2015 (best year on record), blue is the median, and black is for 2009 (the worst year since the Great Depression for hotels).
Currently the occupancy rate, to date, is ahead of last year, and just behind the record year in 2015. The hurricanes might push the annual occupancy rate to a new record.
Seasonally, the occupancy rate will remain close to this level during the Fall business travel season.
Data Source: STR, Courtesy of HotelNewsNow.com
Update: Real Estate Agent Boom and Bust
by Calculated Risk on 10/12/2017 12:15:00 PM
Way back in 2005, I posted a graph of the Real Estate Agent Boom. Here is another update to the graph.
The graph shows the number of real estate licensees in California.
The number of agents peaked at the end of 2007 (housing activity peaked in 2005, and prices in 2006).
The number of salesperson's licenses is off 29% from the peak, and is increasing again (up 6.6% from low). The number of salesperson's licenses has increased to July 2004 levels.
Brokers' licenses are off 12.9% from the peak and have only fallen to February 2006 levels, but are still slowly declining (down almost 1% year-over-year).
 Click on graph for larger image.
We are seeing a pickup in Real Estate licensees in California, although the number of Brokers is still declining.
Weekly Initial Unemployment Claims decrease to 243,000
by Calculated Risk on 10/12/2017 08:34:00 AM
The DOL reported:
In the week ending October 7, the advance figure for seasonally adjusted initial claims was 243,000, a decrease of 15,000 from the previous week's revised level. The previous week's level was revised down by 2,000 from 260,000 to 258,000. The 4-week moving average was 257,500, a decrease of 9,500 from the previous week's revised average. The previous week's average was revised down by 1,250 from 268,250 to 267,000.The previous week was revised down.
Hurricanes Harvey, Irma, and Maria impacted this week's claims.
emphasis added
The following graph shows the 4-week moving average of weekly claims since 1971.
 Click on graph for larger image.
The dashed line on the graph is the current 4-week average. The four-week average of weekly unemployment claims decreased to 257,500.
This was below the consensus forecast. The recent increase in claims is due to the hurricanes.
Wednesday, October 11, 2017
Port of Long Beach: Record Month, "Looks like retailers are optimistic about the holiday season"
by Calculated Risk on 10/11/2017 06:45:00 PM
From the Port of Long Beach: Port of Long Beach Sets Record for September
Cargo volume continues to break records at the Port of Long Beach, which moved more containers last month than any September in its history.CR Note: I'll have more on port traffic soon.
The 701,619 twenty-foot equivalent units (TEUs) processed in Long Beach for September — up 28.3 percent — also resulted in the Port’s best quarter ever. In the third quarter (July, August and September), the Port of Long Beach handled 2,114,306 TEUs, as volumes swelled 15.9 percent over the same period last year.
“Simply put, we are having the best trade months in Port history,” said Harbor Commission President Lou Anne Bynum. “Back-to-school merchandise was strong for us, and it looks like retailers are optimistic about the holiday season.”
Thursday:
• At 8:30 AM ET, The initial weekly unemployment claims report will be released. The consensus is for 252 thousand initial claims, down from 260 thousand the previous week.
• Also at 8:30 AM, The Producer Price Index for September from the BLS. The consensus is a 0.4% increase in PPI, and a 0.2% increase in core PPI.
FOMC Minutes: "Many participants thought" December Rate Hike "likely to be warranted"
by Calculated Risk on 10/11/2017 03:05:00 PM
From the Fed: Minutes of the Federal Open Market Committee, September 19-20, 2017. Excerpts:
In their discussion of monetary policy, all participants agreed that the economy had evolved broadly as they had anticipated at the time of the June meeting and that the incoming data had not materially altered the medium-term economic outlook. Consistent with those assessments, participants saw it as appropriate, at this meeting, to announce implementation of the plan for reducing the Federal Reserve's securities holdings that the Committee released in June. Many underscored that the reduction in securities holdings would be gradual and that financial market participants appeared to have a clear understanding of the Committee's planned approach for a gradual normalization of the size of the Federal Reserve's balance sheet. Consequently, participants generally expected that any reaction in financial markets to the start of balance sheet normalization would likely be limited.
...
Consistent with the expectation that a gradual rise in the federal funds rate would be appropriate, many participants thought that another increase in the target range later this year was likely to be warranted if the medium-term outlook remained broadly unchanged. Several others noted that, in light of the uncertainty around their outlook for inflation, their decision on whether to take such a policy action would depend importantly on whether the economic data in coming months increased their confidence that inflation was moving up toward the Committee's objective. A few participants thought that additional increases in the federal funds rate should be deferred until incoming information confirmed that the low readings on inflation this year were not likely to persist and that inflation was clearly on a path toward the Committee's symmetric 2 percent objective over the medium term. All agreed that they would closely monitor and assess incoming data before making any further adjustment to the federal funds rate.
emphasis added
BLS: Job Openings Decreased Slightly in August
by Calculated Risk on 10/11/2017 10:06:00 AM
From the BLS: Job Openings and Labor Turnover Summary
The number of job openings was little changed at 6.1 million on the last business day of August, the U.S. Bureau of Labor Statistics reported today. Over the month, hires and separations were also little changed at 5.4 million and 5.2 million, respectively. Within separations, the quits rate and the layoffs and discharges rate were little changed at 2.1 percent and 1.2 percent, respectively. ...The following graph shows job openings (yellow line), hires (dark blue), Layoff, Discharges and other (red column), and Quits (light blue column) from the JOLTS.
The number of quits was little changed at 3.1 million in August. The quits rate was 2.1 percent. The number of quits was little changed for total private and for government. Quits decreased in information (-14,000) and mining and logging (-6,000). In the regions, the number of quits increased in the West but decreased in the South.
emphasis added
This series started in December 2000.
Note: The difference between JOLTS hires and separations is similar to the CES (payroll survey) net jobs headline numbers. This report is for August, the most recent employment report was for September.
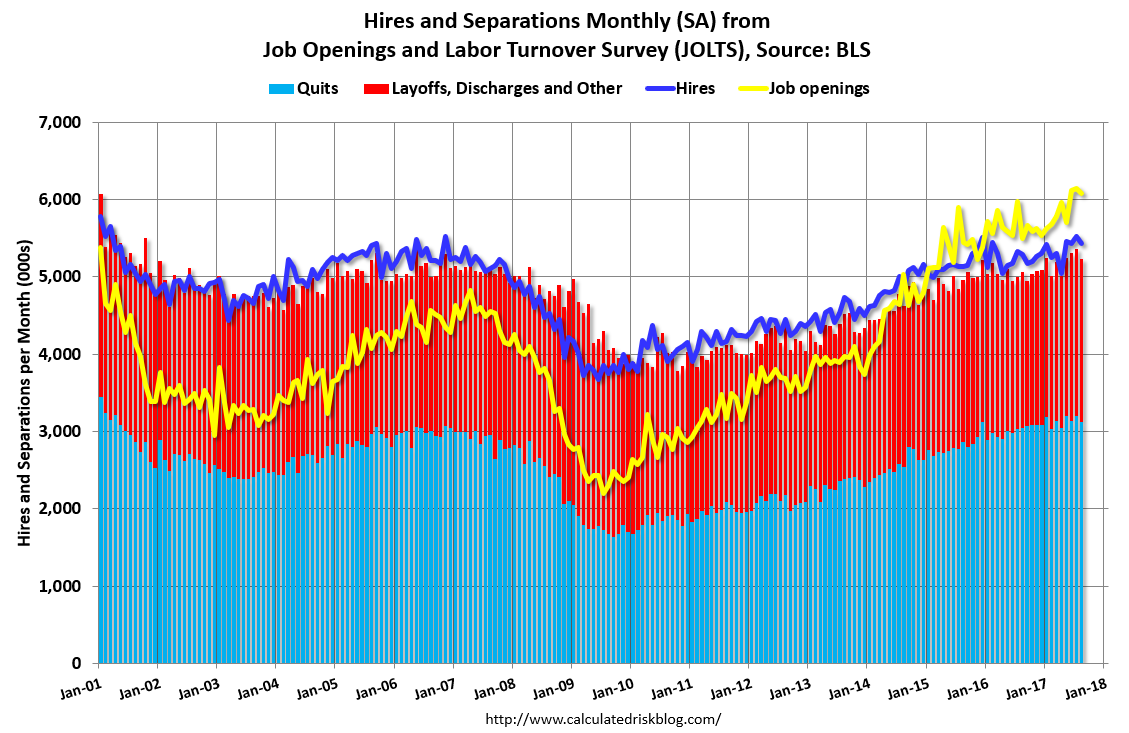 Click on graph for larger image.
Note that hires (dark blue) and total separations (red and light blue columns stacked) are pretty close each month. This is a measure of labor market turnover. When the blue line is above the two stacked columns, the economy is adding net jobs - when it is below the columns, the economy is losing jobs.
Jobs openings decreased in August to 6.082 million from 6.140 in July. Note: July had the highest number of job openings since this series started in December 2000.
The number of job openings (yellow) are up 11% year-over-year.
Quits are up 2% year-over-year. These are voluntary separations. (see light blue columns at bottom of graph for trend for "quits").
Job openings are mostly moving sideways at a high level, and quits are increasing year-over-year. This is another strong report.


