by Calculated Risk on 6/16/2017 10:24:00 AM
Friday, June 16, 2017
BLS: Unemployment Rates Lower in 9 states in May, Four States at New Series Lows
From the BLS: Regional and State Employment and Unemployment Summary
Unemployment rates were lower in May in 9 states, higher in 3 states, and stable in 38 states and the District of Columbia, the U.S. Bureau of Labor Statistics reported today. Twenty-two states had jobless rate decreases from a year earlier and 28 states and the District had little or no change.
...
Colorado had the lowest unemployment rate in May, 2.3 percent, followed by North Dakota, 2.5 percent. The rates in Arkansas (3.4 percent), Mississippi (4.9 percent), Oregon (3.6 percent), and Washington (4.5 percent) set new series lows. (All state series begin in 1976.) Alaska and New Mexico had the highest jobless rates, 6.7 percent and 6.6 percent, respectively.
emphasis added
 Click on graph for larger image.
This graph shows the current unemployment rate for each state (red), and the max during the recession (blue). All states are well below the maximum unemployment rate for the recession.
The size of the blue bar indicates the amount of improvement. The yellow squares are the lowest unemployment rate per state since 1976.
Note: The larger yellow markers indicate the states that reached the all time low since the end of the 2007 recession. These nine states are: Arkansas, California, Colorado, Maine, Mississippi, North Dakota, Oregon, Washington, and Wisconsin.
The states are ranked by the highest current unemployment rate. Alaska, at 6.7%, had the highest state unemployment rate.
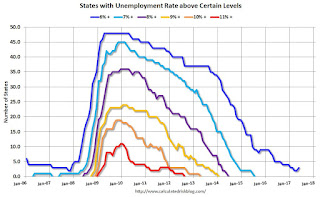
 The second graph shows the number of states (and D.C.) with unemployment rates at or above certain levels since January 2006. At the worst of the employment recession, there were 11 states with an unemployment rate at or above 11% (red).
Currently no state has an unemployment rate at or above 7% (light blue); Only two states and D.C. are at or above 6% (dark blue). The states are Alaska (6.7%) and New Mexico (6.6%). D.C. is at 6.0%.
Housing Starts decreased to 1.092 Million Annual Rate in May
by Calculated Risk on 6/16/2017 09:16:00 AM
From the Census Bureau: Permits, Starts and Completions
Housing Starts:
Privately-owned housing starts in May were at a seasonally adjusted annual rate of 1,092,000. This is 5.5 percent below the revised April estimate of 1,156,000 and is 2.4 percent below the May 2016 rate of 1,119,000. Single-family housing starts in May were at a rate of 794,000; this is 3.9 percent below the revised April figure of 826,000. The May rate for units in buildings with five units or more was 284,000.
Building Permits:
Privately-owned housing units authorized by building permits in May were at a seasonally adjusted annual rate of 1,168,000. This is 4.9 percent below the revised April rate of 1,228,000 and is 0.8 percent below the May 2016 rate of 1,178,000. Single-family authorizations in May were at a rate of 779,000; this is 1.9 percent below the revised April figure of 794,000. Authorizations of units in buildings with five units or more were at a rate of 358,000 in May.
emphasis added
 Click on graph for larger image.
The first graph shows single and multi-family housing starts for the last several years.
Multi-family starts (red, 2+ units) decreased in May compared to April. Multi-family starts are down 23% year-over-year.
Multi-family is volatile and has been down significantly over the last few months.
Single-family starts (blue) decreased in May, and are up 8.5% year-over-year.
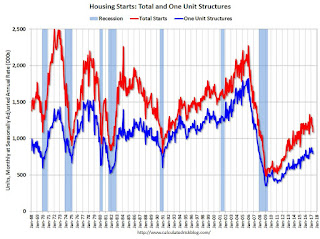
 The second graph shows total and single unit starts since 1968.
 The second graph shows the huge collapse following the housing bubble, and then - after moving sideways for a couple of years - housing is now recovering (but still historically low),
Total housing starts in May were well below expectations, and March and April were revised down. Most of the recent weakness has been due to multi-family. This is a weak report. I'll have more later ...
Thursday, June 15, 2017
Friday: Housing Starts
by Calculated Risk on 6/15/2017 07:42:00 PM
Friday:
• At 8:30 AM ET, Housing Starts for May. The consensus is for 1.221 million, up from the April rate of 1.172 million.
• At 10:00 AM, Regional and State Employment and Unemployment (Monthly) for May 2017
• Also at 10:00 AM, University of Michigan's Consumer sentiment index (preliminary for June). The consensus is for a reading of 97.1, unchanged from 97.1 in May.
Sacramento Housing in May: Sales up 7%, Active Inventory down 14% YoY
by Calculated Risk on 6/15/2017 01:45:00 PM
During the recession, I started following the Sacramento market to look for changes in the mix of houses sold (equity, REOs, and short sales). For several years, not much changed. But in 2012 and 2013, we saw some significant changes with a dramatic shift from distressed sales to more normal equity sales.
This data suggested healing in the Sacramento market and other distressed markets showed similar improvement. Note: The Sacramento Association of REALTORS® started breaking out REOs in May 2008, and short sales in June 2009.
In May, total sales were up 7.4% from May 2016, and conventional equity sales were up 9.8% compared to the same month last year.
In May, 4.2% of all resales were distressed sales. This was down from 4.7% last month, and down from 7.0% in May 2016.
The percentage of REOs was at 2.1%, and the percentage of short sales was 2.1%.
Here are the statistics.

This graph shows the percent of REO sales, short sales and conventional sales.
There has been a sharp increase in conventional (equity) sales that started in 2012 (blue) as the percentage of distressed sales declined sharply.
Active Listing Inventory for single family homes decreased 13.9% year-over-year (YoY) in May. This was the 25th consecutive monthly YoY decrease in inventory in Sacramento.
Cash buyers accounted for 14.6% of all sales - this has been generally declining (frequently investors).
Summary: This data suggests a normal market with few distressed sales, and less investor buying - but with limited inventory.
Earlier: NY and Philly Manufacturing Surveys Suggest Solid Growth in June
by Calculated Risk on 6/15/2017 11:15:00 AM
Earlier, from the NY Fed: Empire State Manufacturing Survey
Business activity rebounded strongly in New York State, according to firms responding to the June 2017 Empire State Manufacturing Survey. The headline general business conditions index shot up twenty-one points to 19.8, its highest level in more than two years. The new orders index posted a similar increase, rising twenty-three points to 18.1, and the shipments index advanced to 22.3.The inventories index climbed to 7.7, indicating a rise in inventory levels, and labor market indicators pointed to a modest increase in employment and hours worked. The pace of input price increases was unchanged, while selling price increases picked up somewhat. Looking ahead, firms remained optimistic about the six-month outlook.And from the Philly Fed: June 2017 Manufacturing Business Outlook Survey
emphasis added
Regional manufacturing continues to expand, according to results from the June Manufacturing Business Outlook Survey. ... The index for current manufacturing activity in the region decreased from a reading of 38.8 in May to 27.6 this month ... Firms reported overall increases in manufacturing employment this month, but the current employment index fell 1 point. The index has remained positive for seven consecutive months.Here is a graph comparing the regional Fed surveys and the ISM manufacturing index:
 Click on graph for larger image.
The New York and Philly Fed surveys are averaged together (yellow, through June), and five Fed surveys are averaged (blue, through May) including New York, Philly, Richmond, Dallas and Kansas City. The Institute for Supply Management (ISM) PMI (red) is through May (right axis).
This suggests the ISM manufacturing index will show solid expansion in June.
NAHB: Builder Confidence decreased to 67 in June
by Calculated Risk on 6/15/2017 10:05:00 AM
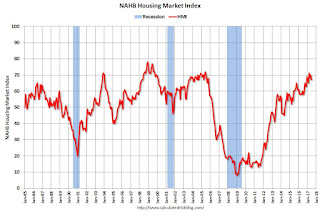
The National Association of Home Builders (NAHB) reported the housing market index (HMI) was at 67 in June, down from 69 in May. Any number above 50 indicates that more builders view sales conditions as good than poor.
From NAHB: Builder Confidence Remains Solid in June
Builder confidence in the market for newly-built single-family homes weakened slightly in June, down two points to a level of 67 from a downwardly revised May reading of 69 on the National Association of Home Builders/Wells Fargo Housing Market Index (HMI).
“Builder confidence levels have remained consistently sound this year, reflecting the ongoing gradual recovery of the housing market,” said NAHB Chairman Granger MacDonald, a home builder and developer from Kerrville, Texas.
“As the housing market strengthens and more buyers enter the market, builders continue to express their frustration over an ongoing shortage of skilled labor and buildable lots that is impeding stronger growth in the single-family sector,” said NAHB Chief Economist Robert Dietz.
...
All three HMI components posted losses in June but remain at healthy levels. The components gauging current sales conditions fell two points to 73 while the index charting sales expectations in the next six months dropped two points to 76. Meanwhile, the component measuring buyer traffic also moved down two points to 49.
Looking at the three-month moving averages for regional HMI scores, the Midwest and South each edged one point lower to 67 and 70, respectively. The Northeast and West both dropped two points to 46 and 76, respectively.
emphasis added
 Click on graph for larger image.
This graph show the NAHB index since Jan 1985.
This was below the consensus forecast, but still a strong reading.
Industrial Production Unchanged in May
by Calculated Risk on 6/15/2017 09:21:00 AM
From the Fed: Industrial production and Capacity Utilization
Industrial production was unchanged in May following a large increase in April and smaller increases in February and March. Manufacturing output declined 0.4 percent in May; the index is little changed, on net, since February. The indexes for mining and utilities posted gains of 1.6 percent and 0.4 percent, respectively, in May. At 105.0 percent of its 2012 average, total industrial production in May was 2.2 percent above its year-earlier level. Capacity utilization for the industrial sector edged down 0.1 percentage point in May to 76.6 percent, a rate that is 3.3 percentage points below its long-run (1972–2016) average.
emphasis added
 Click on graph for larger image.
This graph shows Capacity Utilization. This series is up 10.0 percentage points from the record low set in June 2009 (the series starts in 1967).
Capacity utilization at 76.6% is 3.3% below the average from 1972 to 2015 and below the pre-recession level of 80.8% in December 2007.
Note: y-axis doesn't start at zero to better show the change.
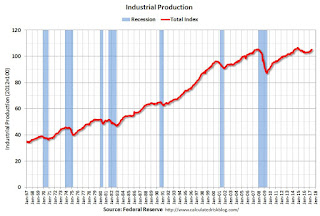
 The second graph shows industrial production since 1967.
Industrial production was unchanged in May at 105.0. This is 20.6% above the recession low, and is close to the pre-recession peak.
This was below expectations.
Weekly Initial Unemployment Claims decrease to 237,000
by Calculated Risk on 6/15/2017 08:35:00 AM
The DOL reported:
In the week ending June 10, the advance figure for seasonally adjusted initial claims was 237,000, a decrease of 8,000 from the previous week's unrevised level of 245,000. The 4-week moving average was 243,000, an increase of 1,000 from the previous week's unrevised average of 242,000.The previous week was unrevised.
emphasis added
The following graph shows the 4-week moving average of weekly claims since 1971.
 Click on graph for larger image.
The dashed line on the graph is the current 4-week average. The four-week average of weekly unemployment claims increased to 243,000.
This was below the consensus forecast.
The low level of claims suggests relatively few layoffs.
Wednesday, June 14, 2017
Mortgage "Rates Drop to 8-Month Lows"
by Calculated Risk on 6/14/2017 06:08:00 PM
From Matthew Graham at Mortgage News Daily: Rates Drop to 8-Month Lows
Mortgage rates fell convincingly today, though not all lenders adjusted rates sheets in proportion to the gains seen in bond markets (which underlie rate movement). Those gains came early, with this morning's economic data coming in much weaker than expected. Markets were especially sensitive to the Consumer Price Index (an inflation report) which showed core annual inflation at 1.7% versus a median forecast of 1.9%. [30 Year fixed at 3.875%].Thursday:
...
[T]he day ended with most lenders offering their lowest rates in exactly 8 months ( a few days following the presidential election).
emphasis added
• At 8:30 AM ET, The initial weekly unemployment claims report will be released. The consensus is for 242 thousand initial claims, down from 245 thousand the previous week.
• Also at 8:30 AM, The New York Fed Empire State manufacturing survey for June. The consensus is for a reading of 5.0, up from -1.0.
• Also at 8:30 AM, the Philly Fed manufacturing survey for June. The consensus is for a reading of 27.0, down from 38.8.
• At 9:15 AM, The Fed will release Industrial Production and Capacity Utilization for May. The consensus is for a 0.2% increase in Industrial Production, and for Capacity Utilization to increase to 76.8%.
• At 10:00 AM, the June NAHB homebuilder survey. The consensus is for a reading of 70, unchanged from 70 in May. Any number above 50 indicates that more builders view sales conditions as good than poor.
FOMC Projections and Press Conference Link
by Calculated Risk on 6/14/2017 02:09:00 PM
Statement here. 25 bps rate hike.
Yellen press conference video here.
On the projections, projections for GDP in 2017 narrowed slightly.
| GDP projections of Federal Reserve Governors and Reserve Bank presidents | |||
|---|---|---|---|
| Change in Real GDP1 | 2017 | 2018 | 2019 |
| June 2017 | 2.1 to 2.2 | 1.8 to 2.2 | 1.8 to 2.0 |
| Mar 2017 | 2.0 to 2.2 | 1.8 to 2.3 | 1.8 to 2.0 |
The unemployment rate was at 4.3% in May, so unemployment rate projections were revised down.
| Unemployment projections of Federal Reserve Governors and Reserve Bank presidents | |||
|---|---|---|---|
| Unemployment Rate2 | 2017 | 2018 | 2019 |
| June 2017 | 4.2 to 4.3 | 4.0 to 4.3 | 4.1 to 4.4 |
| Mar 2017 | 4.5 to 4.6 | 4.3 to 4.6 | 4.3 to 4.7 |
As of April, PCE inflation was up 1.7% from April 2016. Inflation was revised down for 2017.
| Inflation projections of Federal Reserve Governors and Reserve Bank presidents | |||
|---|---|---|---|
| PCE Inflation1 | 2017 | 2018 | 2019 |
| June 2017 | 1.6 to 1.7 | 1.8 to 2.0 | 2.0 to 2.1 |
| Mar 2017 | 1.8 to 2.0 | 1.9 to 2.0 | 2.0 to 2.1 |
PCE core inflation was up 1.5% in April year-over-year. Core PCE inflation was revised down for 2017.
| Core Inflation projections of Federal Reserve Governors and Reserve Bank presidents | |||
|---|---|---|---|
| Core Inflation1 | 2017 | 2018 | 2019 |
| June 2017 | 1.6 to 1.7 | 1.8 to 2.0 | 2.0 to 2.1 |
| Mar 2017 | 1.8 to 1.9 | 1.9 to 2.0 | 2.0 to 2.1 |


