by Calculated Risk on 1/31/2017 08:01:00 PM
Tuesday, January 31, 2017
Wednesday: FOMC, Auto Sales, ISM Mfg, ADP Employment, Construction Spending
Wednesday:
• At 7:00 AM ET, The Mortgage Bankers Association (MBA) will release the results for the mortgage purchase applications index.
• At 8:15 AM, The ADP Employment Report for January. This report is for private payrolls only (no government). The consensus is for 168,000 payroll jobs added in January, up from 153,000 added in December.
• At 10:00 AM, ISM Manufacturing Index for January. The consensus is for the ISM to be at 55.0, up from 54.7 in December. The employment index was at 53.1% in December, and the new orders index was at 60.2%.
• At 10:00 AM, Construction Spending for December. The consensus is for a 0.2% increase in construction spending.
• All day, Light vehicle sales for January. The consensus is for light vehicle sales to decrease to 17.7 million SAAR in January, from 18.4 million in December (Seasonally Adjusted Annual Rate).
• At 2:00 PM, FOMC Meeting Announcement. No change to FOMC policy is expected at this meeting.
Lawler: Table of Distressed Sales and All Cash Sales for Selected Cities in December
by Calculated Risk on 1/31/2017 05:11:00 PM
Economist Tom Lawler sent me the table below of short sales, foreclosures and all cash sales for selected cities in December.
On distressed: The total "distressed" share is down year-over-year in all of these markets.
Short sales and foreclosures are mostly down in these areas.
The All Cash Share (last two columns) is mostly declining year-over-year. As investors continue to pull back, the share of all cash buyers continues to decline.
| Short Sales Share | Foreclosure Sales Share | Total "Distressed" Share | All Cash Share | |||||
|---|---|---|---|---|---|---|---|---|
| Dec- 2016 | Dec- 2015 | Dec- 2016 | Dec- 2015 | Dec- 2016 | Dec- 2015 | Dec- 2016 | Dec- 2015 | |
| Las Vegas | 4.8% | 6.8% | 6.2% | 5.9% | 11.0% | 12.7% | 28.7% | 28.4% |
| Reno** | 1.0% | 4.0% | 3.0% | 2.0% | 4.0% | 6.0% | ||
| Phoenix | 1.7% | 3.7% | 2.1% | 2.9% | 3.8% | 6.6% | 23.1% | 23.9% |
| Sacramento | 2.3% | 4.0% | 2.6% | 4.0% | 4.9% | 8.0% | 15.3% | 16.2% |
| Minneapolis | 1.6% | 2.6% | 5.5% | 9.0% | 7.1% | 11.6% | 12.8% | 13.3% |
| Mid-Atlantic | 3.4% | 4.2% | 9.3% | 12.5% | 12.7% | 16.7% | 16.5% | 18.7% |
| So. California* | 4.8% | 7.0% | 21.1% | 21.0% | ||||
| Florida SF | 2.0% | 3.3% | 7.4% | 14.4% | 9.3% | 17.7% | 28.3% | 33.7% |
| Florida C/TH | 1.2% | 2.1% | 5.7% | 12.1% | 6.9% | 14.1% | 55.8% | 60.5% |
| Miami-Dade Co SF | 3.7% | 6.7% | 11.2% | 28.7% | 14.9% | 35.3% | 27.1% | 34.5% |
| Miami-Dade Co CTH | 2.3% | 2.9% | 10.8% | 17.0% | 13.1% | 19.9% | 57.6% | 64.5% |
| Northeast Florida | 13.1% | 24.0% | ||||||
| Chicago (city) | 14.6% | 17.9% | ||||||
| Spokane | 8.4% | 14.4% | ||||||
| Chicago (city) | 14.6% | 17.9% | ||||||
| Rhode Island | 9.5% | 11.0% | ||||||
| Toledo | 25.6% | 33.4% | ||||||
| Tucson | 23.7% | 28.0% | ||||||
| Knoxville | 21.6% | 25.4% | ||||||
| Peoria | 28.3% | 24.0% | ||||||
| Georgia*** | 20.7% | 22.7% | ||||||
| Omaha | 15.7% | 19.0% | ||||||
| Richmond VA | 8.5% | 11.4% | 15.4% | 19.8% | ||||
| Memphis | 10.3% | 15.6% | ||||||
| *share of existing home sales, based on property records **Single Family Only ***GAMLS | ||||||||
Real Prices and Price-to-Rent Ratio in November
by Calculated Risk on 1/31/2017 02:37:00 PM
Here is the earlier post on Case-Shiller: Case-Shiller: National House Price Index increased 5.6% year-over-year in November
It has been more than ten years since the bubble peak. In the Case-Shiller release this morning, the seasonally adjusted National Index (SA), was reported as being slightly above the previous bubble peak. However, in real terms, the National index (SA) is still about 14.9% below the bubble peak.
The year-over-year increase in prices is mostly moving sideways now around 5%. In November, the index was up 5.6% YoY.
In the earlier post, I graphed nominal house prices, but it is also important to look at prices in real terms (inflation adjusted). Case-Shiller, CoreLogic and others report nominal house prices. As an example, if a house price was $200,000 in January 2000, the price would be close to $277,000 today adjusted for inflation (38.5%). That is why the second graph below is important - this shows "real" prices (adjusted for inflation).
Nominal House Prices

In nominal terms, the Case-Shiller National index (SA) is at a new peak, and the Case-Shiller Composite 20 Index (SA) is back to August 2005 levels, and the CoreLogic index (NSA) is back to September 2005.
Real House Prices

In real terms, the National index is back to April 2004 levels, the Composite 20 index is back to November 2003, and the CoreLogic index back to March 2004.
In real terms, house prices are back to late 2003 / early 2004 levels.
Price-to-Rent
In October 2004, Fed economist John Krainer and researcher Chishen Wei wrote a Fed letter on price to rent ratios: House Prices and Fundamental Value. Kainer and Wei presented a price-to-rent ratio using the OFHEO house price index and the Owners' Equivalent Rent (OER) from the BLS.

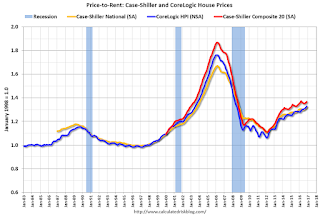
This graph shows the price to rent ratio (January 1998 = 1.0).
On a price-to-rent basis, the Case-Shiller National index is back to October 2003 levels, the Composite 20 index is back to June 2003 levels, and the CoreLogic index is back to July 2003.
In real terms, and as a price-to-rent ratio, prices are back to late 2003 / early 2004 - and the price-to-rent ratio maybe moving a little more sideways now.
HVS: Q4 2016 Homeownership and Vacancy Rates
by Calculated Risk on 1/31/2017 10:45:00 AM
The Census Bureau released the Residential Vacancies and Homeownership report for Q4 2016.
This report is frequently mentioned by analysts and the media to track household formation, the homeownership rate, and the homeowner and rental vacancy rates. However, there are serious questions about the accuracy of this survey.
This survey might show the trend, but I wouldn't rely on the absolute numbers. The Census Bureau is investigating the differences between the HVS, ACS and decennial Census, and analysts probably shouldn't use the HVS to estimate the excess vacant supply or household formation, or rely on the homeownership rate, except as a guide to the trend.

The Red dots are the decennial Census homeownership rates for April 1st 1990, 2000 and 2010. The HVS homeownership rate increased to 63.7% in Q4, from 63.5% in Q3.
I'd put more weight on the decennial Census numbers - and given changing demographics, the homeownership rate is probably close to a bottom.

Once again - this probably shows the general trend, but I wouldn't rely on the absolute numbers.

The quarterly HVS is the most timely survey on households, but there are many questions about the accuracy of this survey.
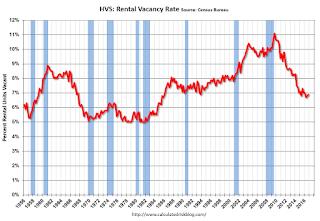
Overall this suggests that vacancies have declined significantly, and my guess is the homeownership rate is probably close to the bottom.
Case-Shiller: National House Price Index increased 5.6% year-over-year in November
by Calculated Risk on 1/31/2017 09:38:00 AM
S&P/Case-Shiller released the monthly Home Price Indices for November ("November" is a 3 month average of September, October and November prices).
This release includes prices for 20 individual cities, two composite indices (for 10 cities and 20 cities) and the monthly National index.
Note: Case-Shiller reports Not Seasonally Adjusted (NSA), I use the SA data for the graphs.
From S&P: The S&P CoreLogic Case-Shiller National Index Hits New Peak as Home Prices Gains Continue
The S&P CoreLogic Case-Shiller U.S. National Home Price NSA Index, covering all nine U.S. census divisions, reported a 5.6% annual gain in November, up from 5.5% last month. The 10-City Composite posted a 4.5% annual increase, up from 4.3% the previous month. The 20-City Composite reported a year-over-year gain of 5.3%, up from 5.1% in October.
Seattle, Portland, and Denver reported the highest year-over-year gains among the 20 cities over each of the last 10 months. In November, Seattle led the way with a 10.4% year-over-year price increase, followed by Portland with 10.1%, and Denver with an 8.7% increase. Eight cities reported greater price increases in the year ending November 2016 versus the year ending October 2016.
...
Before seasonal adjustment, the National Index posted a month-over-month gain of 0.2% in November. Both the 10-City Composite and the 20-City Composite posted 0.2% increases in November. After seasonal adjustment, the National Index recorded a 0.8% month-over-month increase, while both the 10-City and 20-City Composites each reported 0.9% month-over-month increases. Ten of 20 cities reported increases in November before seasonal adjustment; after seasonal adjustment, all 20 cities saw prices rise.
emphasis added
 Click on graph for larger image.
 The first graph shows the nominal seasonally adjusted Composite 10, Composite 20 and National indices (the Composite 20 was started in January 2000).
The Composite 10 index is off 9.2% from the peak, and up 0.9% in November (SA).
The Composite 20 index is off 7.0% from the peak, and up 0.9% (SA) in November.
The National index is slightly above the previous peak (SA), and up 0.8% (SA) in November. The National index is up 36.1% from the post-bubble low set in December 2011 (SA).
 The second graph shows the Year over year change in all three indices.
The Composite 10 SA is up 4.5% compared to November 2015.
The Composite 20 SA is up 5.3% year-over-year.
The National index SA is up 5.6% year-over-year.
Note: According to the data, prices increased in all 20 cities month-over-month seasonally adjusted.
I'll have more later.
Monday, January 30, 2017
Tuesday: Case-Shiller House Prices, Chicago PMI
by Calculated Risk on 1/30/2017 07:54:00 PM
From Matthew Graham at Mortgage News Daily: Mortgage Rates Slightly Lower to Begin Week
Mortgage rates fell modestly today, keeping rates near the lower end of the range seen since January 18th. The catch is that rates moved sharply higher on the 18th, and from there, you'd have to go back to late December to see anything higher. Simply put, we're at the lower end of the recently higher range. ... 4.25% remains the most prevalent quote on top tier conventional 30yr fixed scenarios.Thursday:
emphasis added
• At 9:00 AM ET, S&P/Case-Shiller House Price Index for November. Although this is the November report, it is really a 3 month average of September, October and November prices. The consensus is for a 5.0% year-over-year increase in the Comp 20 index for November. The Zillow forecast is for the National Index to increase 5.6% year-over-year in November.
• At 9:45 AM, Chicago Purchasing Managers Index for January. The consensus is for a reading of 55.2, up from 54.6 in December.
Fannie Mae: Mortgage Serious Delinquency rate decreased in December, Lowest since March 2008
by Calculated Risk on 1/30/2017 05:18:00 PM
Fannie Mae reported today that the Single-Family Serious Delinquency rate decreased to 1.20% in December, down from 1.23% in November. The serious delinquency rate is down from 1.55% in December 2015.
This is the lowest serious delinquency rate since March 2008.
These are mortgage loans that are "three monthly payments or more past due or in foreclosure".
The Fannie Mae serious delinquency rate peaked in February 2010 at 5.59%.

Although the rate is declining, the "normal" serious delinquency rate is under 1%.
The Fannie Mae serious delinquency rate has fallen 0.35 percentage points over the last year, and at that rate of improvement, the serious delinquency rate will not be below 1% for about 7 more months.
Note: Freddie Mac reported earlier.
Dallas Fed: Regional Manufacturing Activity "Continues to Expand" in January
by Calculated Risk on 1/30/2017 02:34:00 PM
From the Dallas Fed: Texas Manufacturing Activity Continues to Expand
Texas factory activity increased for the seventh consecutive month in January, according to business executives responding to the Texas Manufacturing Outlook Survey. The production index, a key measure of state manufacturing conditions, edged down but remained positive at 11.9, suggesting output growth continued but at a slightly slower pace this month. ...This was the last of the regional Fed surveys for January.
...
The general business activity index posted a fourth consecutive positive reading and moved up to 22.1, its highest reading since April 2010.
...
Labor market measures indicated employment gains and longer workweeks. The employment index bounced back to 6.1 after dipping into negative territory last month. Twenty-three percent of firms noted net hiring, compared with 17 percent noting net layoffs. The hours worked index moved up to 9.1, its strongest reading since the end of 2015. ...
emphasis added
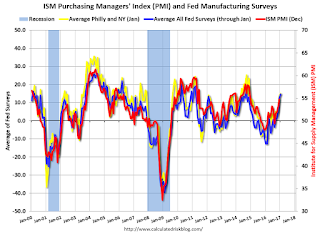
Here is a graph comparing the regional Fed surveys and the ISM manufacturing index:
 Click on graph for larger image.
The New York and Philly Fed surveys are averaged together (yellow, through January), and five Fed surveys are averaged (blue, through January) including New York, Philly, Richmond, Dallas and Kansas City. The Institute for Supply Management (ISM) PMI (red) is through December (right axis).
It seems likely the ISM manufacturing index will show stronger expansion in January, and the consensus is for a reading of 55.0.
Duy: FOMC Preview
by Calculated Risk on 1/30/2017 12:12:00 PM
From Tim Duy at Fed Watch: FOMC Preview
The Fed will take a pass at this week’s FOMC meeting. The median policy participant forecasts just three 25bp rate hikes this year and incoming data offers no surprises to force one of those this month. March, however, remains in play.
The three forecasted rate hikes is not a promise. It could be one hike or could be four or more. The actual outcome will depend on the path of actual economic outcomes and what those outcomes imply for the forecast.
...
he Fed’s crystal ball is as cloudy as everyone else’s, but that’s hard to explain. For example, the potential positive demand shock from expected deficit spending could be overwhelmed by a potential negative supply shock from an increasingly xenophobic Trump Administration.
What does this mean for March? Currently, market participants place low odds of a March rate hike. The underlying bet is that if the Fed moves three times this year, the most likely timing will be June, September, and December. I think this is reasonable; bringing March into that mix requires a change in the tone of the data.
...
At this point I still do not anticipate a March hike. And note that a March move doesn’t guarantee a faster pace of rate hikes; it could be largely pre-emptive, just displacing a subsequent rate hike. But if they could justify a March move and you were anticipating two to three rate hikes this year, you should probably be thinking of three to four. Not to mention some action on the balance sheet added to the mix.
emphasis added
NAR: Pending Home Sales Index increased 1.6% in December, up 0.3% year-over-year
by Calculated Risk on 1/30/2017 10:05:00 AM
From the NAR: Pending Home Sales Bounce Back in December
The Pending Home Sales Index, a forward-looking indicator based on contract signings, increased 1.6 percent to 109.0 in December from 107.3 in November. With last month's uptick in activity, the index is now 0.3 percent above last December (108.7).This was above expectations of a 0.6% increase for this index. Note: Contract signings usually lead sales by about 45 to 60 days, so this would usually be for closed sales in January and February.
...
The PHSI in the Northeast declined 1.6 percent to 96.4 in December, and is now 1.2 percent below a year ago. In the Midwest the index decreased 0.8 percent to 102.7 in December, and is now 3.4 percent lower than December 2015.
Pending home sales in the South rose 2.4 percent to an index of 121.3 in December and are now 0.5 percent above last December. The index in the West jumped 5.0 percent in December to 106.1, and is now 5.0 percent higher than a year ago.
emphasis added


