by Calculated Risk on 1/19/2017 08:42:00 AM
Thursday, January 19, 2017
Weekly Initial Unemployment Claims decrease to 234,000
The DOL reported:
In the week ending January 14, the advance figure for seasonally adjusted initial claims was 234,000, a decrease of 15,000 from the previous week's revised level. The previous week's level was revised up by 2,000 from 247,000 to 249,000. The 4-week moving average was 246,750, a decrease of 10,250 from the previous week's revised average. This is the lowest level for this average since November 3, 1973 when it was 244,000. The previous week's average was revised up by 500 from 256,500 to 257,000.The previous week was revised up.
There were no special factors impacting this week's initial claims.
emphasis added
The following graph shows the 4-week moving average of weekly claims since 1971.
 Click on graph for larger image.
The dashed line on the graph is the current 4-week average. The four-week average of weekly unemployment claims decreased to 246,750.
This was below the consensus forecast. This is the lowest level for the four week average since 1973 (with a much larger population).
The low level of claims suggests relatively few layoffs.
Housing Starts increased to 1.226 Million Annual Rate in December
by Calculated Risk on 1/19/2017 08:37:00 AM
From the Census Bureau: Permits, Starts and Completions
Housing Starts:
Privately-owned housing starts in December were at a seasonally adjusted annual rate of 1,226,000. This is 11.3 percent above the revised November rate of 1,102,000 and is 5.7 percent above the December 2015 rate of 1,160,000.
Single-family housing starts in December were at a rate of 795,000; this is 4.0 percent below the revised November figure of 828,000. The December rate for units in buildings with five units or more was 417,000.
An estimated 1,166,400 housing units were started in 2016. This is 4.9 percent above the 2015 figure of 1,111,800.
Building Permits:
Privately-owned housing units authorized by building permits in December were at a seasonally adjusted annual rate of 1,210,000. This is 0.2 percent below the revised November rate of 1,212,000, but is 0.7 percent above the December 2015 estimate of 1,201,000.
Single-family authorizations in December were at a rate of 817,000; this is 4.7 percent above the revised November figure of 780,000. Authorizations of units in buildings with five units or more were at a rate of 355,000 in December.
An estimated 1,186,900 housing units were authorized by building permits in 2016. This is 0.4 percent above the 2015 figure of 1,182,600.
emphasis added
 Click on graph for larger image.
The first graph shows single and multi-family housing starts for the last several years.
Multi-family starts (red, 2+ units) increased in December compared to November. Multi-family starts are up 9% year-over-year.
Multi-family is volatile, and the swings have been huge over the last four months.
Single-family starts (blue) decreased in December, and are up 4% year-over-year.
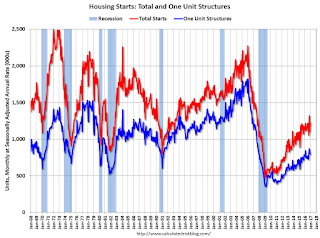
 The second graph shows total and single unit starts since 1968.
 The second graph shows the huge collapse following the housing bubble, and then - after moving sideways for a couple of years - housing is now recovering (but still historically low),
Total housing starts in December were above expectations due to the sharp increase in multi-family starts. However October and November were revised down slightly, combined. Another solid report. I'll have more later ...
Wednesday, January 18, 2017
Thursday: Housing Starts, Unemployment Claims, Philly Fed Mfg Survey, Dr. Yellen
by Calculated Risk on 1/18/2017 08:28:00 PM
Thursday:
• At 8:30 AM ET, The initial weekly unemployment claims report will be released. The consensus is for 255 thousand initial claims, up from 247 thousand the previous week.
• Also at 8:30 AM, Housing Starts for December. The consensus is for 1.200 million, up from the November rate.
• Also at 8:30 AM: the Philly Fed manufacturing survey for January. The consensus is for a reading of 16.0, down from 19.7.
• At 8:00 PM, Speech, Fed Chair Janet Yellen, The Economic Outlook and the Conduct of Monetary Policy, At the Stanford Institute for Economic Policy Research, San Francisco, California
Lawler: Early Read on Existing Home Sales in December
by Calculated Risk on 1/18/2017 04:38:00 PM
From housing economist Tom Lawler: Early Read on Existing Home Sales in December
Based on publicly-available local realtor/MLS reports from across the country released through this morning, I project that existing home sales as estimated by the National Association of Realtors ran at a seasonally adjusted annual rate of 5.55 million, down 1.1% from November’s preliminary pace and up 1.8% from last November’s seasonally-adjusted pace. On the inventory front, local realtor/MLS reports suggest that existing home inventories declined by almost as much last month as they did last December (which was a much larger drop than the seasonal norm), and I project that the NAR inventory number for December will be 1.61 million, down 13.0% from November and down 8.5% from last November. Finally, local realtor/MLS data suggest that the NAR’s median existing SF home sales price for December will be up 6.7% from last December.
CR Note: The NAR is scheduled to release December existing home sales on Tuesday, January 24th.
Fed's Beige Book: Modest expansion, Tight labor markets
by Calculated Risk on 1/18/2017 02:24:00 PM
Fed's Beige Book "This report was prepared at the Federal Reserve Bank of Boston based on information collected on or before January 9, 2017."
Reports from the twelve Federal Reserve Districts indicated that the economy continued to expand at a modest pace across most regions from late November through the end of the year. Manufacturers in most Districts reported increased sales with several citing a turnaround versus earlier in 2016. Growth in the energy industry was mixed; two Districts reported weakness in coal production but others reported improvements in coal, oil, or gas activity. Most Districts said that non-auto retail sales had expanded, but several noted that sales over the holiday season were disappointing and reports in more than one District suggested that growth in e-commerce had come at the expense of bricks-and-mortar retailers. All Districts reported varying degrees of growth in employment and a majority described their labor markets as tight. Residential construction and sales were generally mixed, although San Francisco reported strong real estate market activity throughout the 12th District. Financial conditions were stable. Firms across the country and industries were said to be optimistic about growth in 2017.And on residential real estate for Boston:
emphasis added
Continuing recent trends, residential real estate markets in the First District showed robust increases in sales and prices relative to last year. ... Home prices also rose year-over-year. For single-family homes, the median sales price increased in every reporting region. ... Overall, contacts were optimistic about the outlook for the end of the year and into 2017.Real estate is solid.
Key Measures Show Inflation close to 2% in December
by Calculated Risk on 1/18/2017 12:15:00 PM
The Cleveland Fed released the median CPI and the trimmed-mean CPI this morning:
According to the Federal Reserve Bank of Cleveland, the median Consumer Price Index rose 0.2% (2.5% annualized rate) in December. The 16% trimmed-mean Consumer Price Index also rose 0.2% (2.5% annualized rate) during the month. The median CPI and 16% trimmed-mean CPI are measures of core inflation calculated by the Federal Reserve Bank of Cleveland based on data released in the Bureau of Labor Statistics' (BLS) monthly CPI report.Note: The Cleveland Fed released the median CPI details for December here. Motor fuel was up 42% annualized in December.
Earlier today, the BLS reported that the seasonally adjusted CPI for all urban consumers rose 0.3% (3.4% annualized rate) in December. The CPI less food and energy rose 0.2% (2.8% annualized rate) on a seasonally adjusted basis.
 Click on graph for larger image.
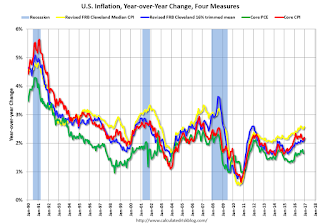
This graph shows the year-over-year change for these four key measures of inflation. On a year-over-year basis, the median CPI rose 2.6%, the trimmed-mean CPI rose 2.2%, and the CPI less food and energy rose 2.2%. Core PCE is for November and increased 1.7% year-over-year.
On a monthly basis, median CPI was at 2.5% annualized, trimmed-mean CPI was at 2.5% annualized, and core CPI was at 2.8% annualized.
Using these measures, inflation has generally been moving up, and most of these measures are above the Fed's 2% target (Core PCE is still below).
AIA: Architecture Billings Index increased in December
by Calculated Risk on 1/18/2017 11:15:00 AM
Note: This index is a leading indicator primarily for new Commercial Real Estate (CRE) investment.
From the AIA: Architecture Billings Index ends year on positive note
The Architecture Billings Index (ABI) concluded the year in positive terrain, with the December reading capping off three straight months of growth in design billings. As a leading economic indicator of construction activity, the ABI reflects the approximate nine to twelve month lead time between architecture billings and construction spending. The American Institute of Architects (AIA) reported the December ABI score was 55.9, up sharply from 50.6 in the previous month. This score reflects the largest increase in design services in 2016 (any score above 50 indicates an increase in billings). The new projects inquiry index was 57.2, down from a reading of 59.5 the previous month.
“The sharp upturn in design activity as we wind down the year is certainly encouraging. This bodes well for the design and construction sector as we enter the new year”,” said AIA Chief Economist, Kermit Baker, Hon. AIA, PhD. “However, December is an atypical month for interpreting trends, so the coming months will tell us a lot more about conditions that the industry is likely to see in 2017.”
...
• Regional averages: Midwest (54.4), Northeast (54.0), South (53.8), West (48.8)
• Sector index breakdown: commercial / industrial (54.3), institutional (53.3), mixed practice (51.9), multi-family residential (50.6)
emphasis added
 Click on graph for larger image.
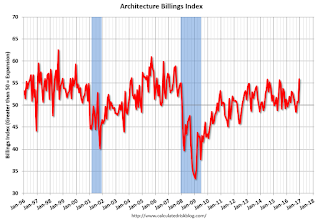
This graph shows the Architecture Billings Index since 1996. The index was at 55.9 in December, up from 50.6 in November. Anything above 50 indicates expansion in demand for architects' services.
Note: This includes commercial and industrial facilities like hotels and office buildings, multi-family residential, as well as schools, hospitals and other institutions.
According to the AIA, there is an "approximate nine to twelve month lag time between architecture billings and construction spending" on non-residential construction. This index was positive in 9 of the last 12 months, suggesting a further increase in CRE investment in 2017.
NAHB: Builder Confidence decreased to 67 in January
by Calculated Risk on 1/18/2017 10:09:00 AM
The National Association of Home Builders (NAHB) reported the housing market index (HMI) was at 67 in January, down from 69 in December. Any number above 50 indicates that more builders view sales conditions as good than poor.
From CNBC: Homebuilder confidence pulls back by 2 points in January after election euphoria
A monthly sentiment index retreated 2 points in January, and December's seven-point jump was revised down by one. The National Association of Home Builders/Wells Fargo Housing Market Index (HMI) now stands at 67.
...
"NAHB expects solid 10 percent growth in single-family construction in 2017, adding to the gains of 2016," said NAHB Chief Economist Robert Dietz. "Concerns going into the year include rising mortgage interest rates as well as a lack of lots and access to labor."
Regionally, on a three-month moving average, sentiment in the Northeast rose two points to 52 and rose three point in the Midwest to 64. The South and West each held steady at 67 and 79, respectively.
emphasis added
 Click on graph for larger image.
This graph show the NAHB index since Jan 1985.
This was below the consensus forecast of 69, but still another solid reading.
Industrial Production increased 0.8% in December
by Calculated Risk on 1/18/2017 09:31:00 AM
From the Fed: Industrial production and Capacity Utilization
Industrial production rose 0.8 percent in December after falling 0.7 percent in November. For the fourth quarter as a whole, the index slipped 0.6 percent at an annual rate. In December, manufacturing output moved up 0.2 percent and mining output was unchanged. The index for utilities jumped 6.6 percent, largely because of a return to more normal temperatures following unseasonably warm weather in November; the gain last month was the largest since December 1989. At 104.6 percent of its 2012 average, total industrial production in December was 0.5 percent above its year-earlier level. Capacity utilization for the industrial sector increased 0.6 percentage point in December to 75.5 percent, a rate that is 4.5 percentage points below its long-run (1972–2015) average.
emphasis added
 Click on graph for larger image.
This graph shows Capacity Utilization. This series is up 8.8 percentage points from the record low set in June 2009 (the series starts in 1967).
Capacity utilization at 75.5% is 4.5% below the average from 1972 to 2015 and below the pre-recession level of 80.8% in December 2007.
Note: y-axis doesn't start at zero to better show the change.
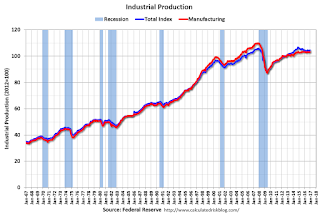
 The second graph shows industrial production since 1967.
Industrial production increased in December to 104.6. This is 19.7% above the recession low, and is close to the pre-recession peak.
This was above expectations of a 0.6% increase.
MBA: Mortgage Applications Increase in Latest Weekly Survey
by Calculated Risk on 1/18/2017 07:00:00 AM
From the MBA: Mortgage Applications Increase in Latest MBA Weekly Survey
Mortgage applications increased 0.8 percent from one week earlier, according to data from the Mortgage Bankers Association’s (MBA) Weekly Mortgage Applications Survey for the week ending January 13, 2017. The previous week’s results included an adjustment for the New Year’s holiday.
... The Refinance Index increased 7 percent from the previous week. The seasonally adjusted Purchase Index decreased 5 percent from one week earlier. The unadjusted Purchase Index increased 25 percent compared with the previous week and was 1 percent lower than the same week one year ago.
...
The average contract interest rate for 30-year fixed-rate mortgages with conforming loan balances ($424,000 or less) decreased to its lowest level since December 2016, 4.27 percent, from 4.32 percent, with points decreasing to 0.39 from 0.41 (including the origination fee) for 80 percent loan-to-value ratio (LTV) loans.
emphasis added
 Click on graph for larger image.
The first graph shows the refinance index since 1990.
It would take a substantial decrease in mortgage rates to see a significant increase in refinance activity - although we might see more cash-out refis.
 The second graph shows the MBA mortgage purchase index.
 Even with the increase in mortgage rates, purchase activity is still holding up. However refinance activity has declined significantly.


