by Calculated Risk on 5/16/2016 10:04:00 AM
Monday, May 16, 2016
NAHB: Builder Confidence unchanged at 58 in May
The National Association of Home Builders (NAHB) reported the housing market index (HMI) was at 58 in May, unchanged from 58 in April. Any number above 50 indicates that more builders view sales conditions as good than poor.
From the NAHB: Builder Confidence Holds Stable in May
Builder confidence in the market for newly-built single-family homes remained unchanged in May at a level of 58 on the National Association of Home Builders/Wells Fargo Housing Market Index (HMI).
“Builder confidence has held steady at 58 for four straight months, which indicates that the single-family housing sector remains in positive territory,” said NAHB Chairman Ed Brady, a home builder and developer from Bloomington, Ill. “However, builders are facing an increasing number of regulations and lot supply constraints.”
The HMI components measuring sales expectations in the next six months increased three points to 65, while the component charting current sales conditions and the index gauging buyer traffic both held steady at 63 and 44, respectively.
“The fact that future sales expectations rose slightly this month shows that builders are confident that the market will continue to strengthen,” said NAHB Chief Economist Robert Dietz. “Job creation, low mortgage interest rates and pent-up demand will also spur growth in the single-family housing sector moving forward.”
...
Looking at the three-month moving averages for regional HMI scores, the South and Midwest both registered one-point gains to 59 and 58, respectively. The West remained unchanged at 67 and the Northeast fell three points to 41.
emphasis added
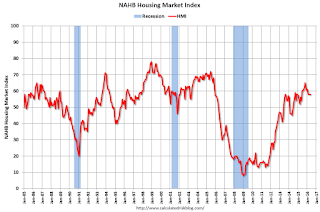 Click on graph for larger image.
This graph show the NAHB index since Jan 1985.
This was below the consensus forecast of 59, but still a strong reading.
NY Fed: May "General business conditions turned negative, falling nineteen points to -9.0"
by Calculated Risk on 5/16/2016 08:39:00 AM
From the NY Fed: Empire State Manufacturing Survey
Business activity contracted for New York manufacturing firms, according to the May 2016 survey. Following a brief foray into positive territory in March and April, the general business conditions index fell back below zero, declining nineteen points to -9.0.This was well below the consensus forecast of 7.0, and suggests manufacturing contracted in the NY region in May.
...
Employment levels remained fairly steady, with the index for number of employees showing little change at 2.1, while the average workweek index declined ten points to -8.3—evidence that the average workweek was shorter this month.
...
Indexes for the six-month outlook generally suggested that firms were somewhat less optimistic about future conditions than they were in April.
Sunday, May 15, 2016
Monday: Empire State Mfg, Homebuilder Survey
by Calculated Risk on 5/15/2016 07:13:00 PM
Weekend:
• Schedule for Week of May 15, 2016
Monday:
• At 8:30 AM ET, the New York Fed Empire State manufacturing survey for May. The consensus is for a reading of 7.0, down from 9.5.
• At 10:00 AM, the May NAHB homebuilder survey. The consensus is for a reading of 59, up from 58 in April. Any number above 50 indicates that more builders view sales conditions as good than poor.
From CNBC: Pre-Market Data and Bloomberg futures: S&P are down 4 and DOW futures are down 30 (fair value).
Oil prices were up over the last week with WTI futures at $46.21 per barrel and Brent at $47.83 per barrel. A year ago, WTI was at $59, and Brent was at $66 - so prices are down about 25% year-over-year.
Here is a graph from Gasbuddy.com for nationwide gasoline prices. Nationally prices are at $2.23 per gallon (down about $0.45 per gallon from a year ago).
Neil Irwin in the NY Times: How life has changed in America over the last 150 Years
by Calculated Risk on 5/15/2016 10:38:00 AM
This is a fascinating article by Neil Irwin in the NY Times: What Was the Greatest Era for Innovation? A Brief Guided Tour.
Irwin discusses the impact of plumbing, air conditioning, improvements in transportation and sanitation, and much more. He discusses what life was like in 1870, 1920, 1970, and now. Great overview.
Some of this article discusses the improvements in life expectancy that I discussed here: The Projected Improvement in Life Expectancy. Here is a graph from that post:
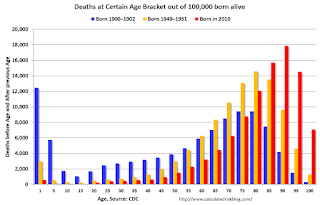
In 1950, only 3.5% died before age 5. In 2010, it was 0.7%.
The peak age for deaths didn't change much for those born in 1900 and 1950 (between 76 and 80, but many more people born in 1950 will make it).
Now the CDC is projecting the peak age for deaths - for those born in 2010 - will increase to 86 to 90!
Also the number of deaths for those younger than 20 will be very small (down to mostly accidents, guns, and drugs). Self-driving cars might reduce the accident components of young deaths.
In 1900, 25,2% died before age 20. And another 26.8% died before 55.
In 1950, 5.3% died before age 20. And another 18.7% died before 55. A dramatic decline in early deaths.
In 2010, 1.5% are projected to die before age 20. And only 9.7% before 55. A dramatic decline in prime working age deaths.
Saturday, May 14, 2016
Schedule for Week of May 15, 2016
by Calculated Risk on 5/14/2016 08:01:00 AM
The key economic reports this week are April housing starts on Tuesday, and April Existing Home Sales on Friday.
For manufacturing, April Industrial Production, and the New York and Philly Fed manufacturing surveys will be released this week.
8:30 AM: the New York Fed Empire State manufacturing survey for May. The consensus is for a reading of 7.0, down from 9.5.
10:00 AM: The May NAHB homebuilder survey. The consensus is for a reading of 59, up from 58 in April. Any number above 50 indicates that more builders view sales conditions as good than poor.
 8:30 AM: Housing Starts for April.
 Total housing starts decreased to 1.089 million (SAAR) in March. Single family starts decreased to 764 thousand SAAR in March.
The consensus for 1.135 million, up from the March rate.
8:30 AM: The Consumer Price Index for May from the BLS. The consensus is for a 0.3% increase in CPI, and a 0.2% increase in core CPI.
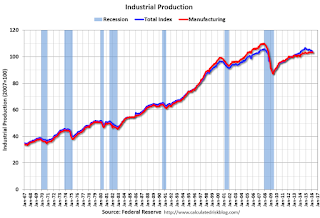 9:15 AM: The Fed will release Industrial Production and Capacity Utilization for April.
This graph shows industrial production since 1967.
The consensus is for a 0.2% increase in Industrial Production, and for Capacity Utilization to increase to 74.9%.
7:00 AM ET: The Mortgage Bankers Association (MBA) will release the results for the mortgage purchase applications index.
During the day: The AIA's Architecture Billings Index for April (a leading indicator for commercial real estate).
2:00 PM: the Fed will release the FOMC Minutes for the meeting of April 26-27, 2016
8:30 AM: The initial weekly unemployment claims report will be released. The consensus is for 275 thousand initial claims, down from 294 thousand the previous week.
8:30 AM: the Philly Fed manufacturing survey for May. The consensus is for a reading of 3.0, up from -1.6.
8:30 AM ET: Chicago Fed National Activity Index for April. This is a composite index of other data.
 10:00 AM: Existing Home Sales for April from the National Association of Realtors (NAR). The consensus is for 5.40 million SAAR, up from 5.33 million in March.
10:00 AM: Regional and State Employment and Unemployment for April 2016
Friday, May 13, 2016
Earlier: Preliminary Consumer Sentiment increases to 95.8
by Calculated Risk on 5/13/2016 02:23:00 PM
Click on graph for larger image.
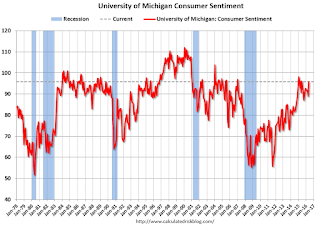
The preliminary University of Michigan consumer sentiment index for May was at 95.8, up from 89.0 in April:
"Consumer sentiment rebounded in early May due to more frequent income gains, an improved jobs outlook, and the expectation of lower inflation and interest rates. The largest gains were recorded among lower income and younger households, although the gains were recorded among all income and age subgroups as well as across all regions. Nearly all of the gains were in the Expectations Index, which rose to its highest level in nearly a year. "
emphasis added
Sacramento Housing in April: Sales down 3.3%, Active Inventory down 17% YoY
by Calculated Risk on 5/13/2016 11:12:00 AM
During the recession, I started following the Sacramento market to look for changes in the mix of houses sold (equity, REOs, and short sales). For a few years, not much changed. But in 2012 and 2013, we saw some significant changes with a dramatic shift from distressed sales to more normal equity sales.
This data suggests healing in the Sacramento market and other distressed markets are showing similar improvement. Note: The Sacramento Association of REALTORS® started breaking out REOs in May 2008, and short sales in June 2009.
In April, total sales were down 3.3% from April 2015, and conventional equity sales were unchanged compared to the same month last year.
In April, 6.5% of all resales were distressed sales. This was down from 10.1% last month, and down from 11.9% in April 2015.
The percentage of REOs was at 3.3% in April, and the percentage of short sales was 3.2%.
Here are the statistics.
Press Release: Inventory stationary, days on market falling, prices inch upward
Sales volume increased 7.9% from 1,440 in April to 1,554. This number is a 3.3% decrease from April 2015 (1,607 sales).
...
Although the total Active Listing Inventory increased 6.5% (1,973 to 2,102), the Months of Inventory remained at 1.4 months. Compared with the total Listing Inventory of April 2015, the current number is down 17.4%, where the Months of Inventory was 1.6 and numbered 2,546 units.
 Click on graph for larger image.
 This graph shows the percent of REO sales, short sales and conventional sales.
There has been a sharp increase in conventional (equity) sales that started in 2012 (blue) as the percentage of distressed sales declined sharply.
Active Listing Inventory for single family homes decreased 17.4% year-over-year (YoY) in April. This was the twelfth consecutive monthly YoY decrease in inventory in Sacramento.
Cash buyers accounted for 16.0% of all sales (frequently investors).
Summary: This data suggests a more normal market with fewer distressed sales, more equity sales, and less investor buying - but limited inventory.
Retail Sales increased 1.3% in April
by Calculated Risk on 5/13/2016 08:38:00 AM
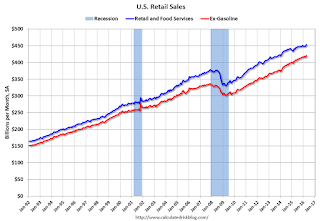
On a monthly basis, retail sales were up 1.3% from March to April (seasonally adjusted), and sales were up 3.0% from April 2015.
From the Census Bureau report:
The U.S. Census Bureau announced today that advance estimates of U.S. retail and food services sales for April, adjusted for seasonal variation and holiday and trading-day differences, but not for price changes, were $453.4 billion, an increase of 1.3 percent from the previous month, and 3.0 percent above April 2015. ... The February 2016 to March 2016 percent change was revised from down 0.4 percent to down 0.3 percent.
 Click on graph for larger image.
This graph shows retail sales since 1992. This is monthly retail sales and food service, seasonally adjusted (total and ex-gasoline).
Retail sales ex-gasoline were up 1.2%.
The second graph shows the year-over-year change in retail sales and food service (ex-gasoline) since 1993.
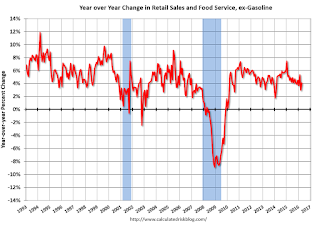 Retail and Food service sales ex-gasoline increased by 4.1% on a YoY basis.
The increase in April was above expectations for the month, and retail sales for February and March were revised up. A strong report.
Thursday, May 12, 2016
Off-Topic: A Comment on Litmus Test Moments
by Calculated Risk on 5/12/2016 06:51:00 PM
Some off-topic rambling ...
A few times in life there are public moments (and private ones too) that really make a difference. As example, for economic forecasters, calling the housing bubble and bust is now a litmus test.
Some people, like Larry Kudlow, failed the test. See Kudlow's June 2005 article: Why the Housing Bears Are Wrong Again
[A]ll the bubbleheads who expect housing-price crashes in Las Vegas or Naples, Florida, to bring down the consumer, the rest of the economy, and the entire stock market [have been dead wrong].I was on the other side (apparently a "bubblehead" according to Kudlow), see my post in 2005: Housing: Speculation is the Key and many other housing related posts in 2005 and 2006. Note: For bonus points, I also called the bottom for house prices. Of course there are also the people who called the bubble, but have been wrong on just about everything else. Oh well.
None of this has happened.
Another litmus test was whether someone supported the Iraq war (especially now among Democrats). Most people are busy with their lives, and rely on the media to vet the arguments for war. But politicians and the media should have been paying close attention (I opposed the Iraq war, and was shouted down and called names like "Saddam lover" for questioning the veracity of the information).
Now we know most of the media failed the American public in 2002 and early 2003, with some exceptions like Walter Pincus at the Washington Post. Ms. Clinton has been criticized for supporting the Iraq invasion, as did Donald Trump (he claims otherwise now - but that claim is false). Opposing the invasion helped President Obama in 2008 - it was a litmus test for many voters.
I believe we are seeing a Litmus Test moment right now, especially for Republicans. I believe, in a few years, whether someone supported Trump or not will make a difference in how people are perceived. This will make or break some political careers.
For the most part, I avoid politics on this blog (although I do analyze some policies). But I think this is one of those key moments, so for the record: I am still a registered Republican, and #ImWithHer
Friday:
• At 8:30 AM ET, Retail sales for April will be released. The consensus is for retail sales to increase 0.9% in April.
• At 8:30 AM, the Producer Price Index for April from the BLS. The consensus is for a 0.3% increase in prices, and a 0.1% increase in core PPI.
• At 10:00 AM, Manufacturing and Trade: Inventories and Sales (business inventories) report for March. The consensus is for a 0.2% increase in inventories.
• At 10:00 AM, University of Michigan's Consumer sentiment index (preliminary for May). The consensus is for a reading of 89.7, up from 89.0 in April.
MBA: "Foreclosures Continue to Decrease, Delinquencies Flat" in Q1
by Calculated Risk on 5/12/2016 02:14:00 PM
From the MBA: Foreclosures Continue to Decrease, Delinquencies Flat
The delinquency rate for mortgage loans on one-to-four-unit residential properties remained unchanged from the previous quarter at a seasonally adjusted rate of 4.77 percent of all loans outstanding at the end of the first quarter of 2016. This was the lowest level since the third quarter of 2006. The delinquency rate was 77 basis points lower than one year ago, according to the Mortgage Bankers Association’s (MBA) National Delinquency Survey.
The percentage of loans on which foreclosure actions were started during the first quarter was 0.35 percent, a decrease of one basis point from the previous quarter, and down 10 basis points from one year ago. This foreclosure starts rate was at the lowest level since the second quarter of 2000.
The delinquency rate includes loans that are at least one payment past due but does not include loans in the process of foreclosure. The percentage of loans in the foreclosure process at the end of the first quarter was 1.74 percent, down three basis points from the previous quarter and 48 basis points lower than one year ago. This was the lowest foreclosure inventory rate seen since the third quarter of 2007.
The serious delinquency rate, the percentage of loans that are 90 days or more past due or in the process of foreclosure, was 3.29 percent, a decrease of 15 basis points from previous quarter, and a decrease of 95 basis points from last year. This was the lowest serious delinquency rate since the third quarter of 2007.
Marina Walsh, MBA’s Vice President of Industry Analysis, offered the following commentary on the survey:
"The delinquency rate of 4.77 percent has returned to typical pre-recession levels and is lower than the historical average of 5.4 percent for the time period from 1979 to the first quarter of 2016.emphasis added
"The rate at which new foreclosures were initiated in the first quarter was 0.35 percent, the lowest in 16 years, and 10 basis points below the historical average of 0.45 percent. A total of 28 states and Washington, DC either saw decreases or no change in the foreclosure starts rate this quarter, while the remaining 22 states experienced increases in the foreclosure starts rate. Only two of these 22 states have strictly non-judicial processes in place.
"Continuing a consistent downward trend that began in the second quarter of 2012, the foreclosure inventory rate fell again in the first quarter of 2016 to 1.74 percent, a decrease of three basis points from the previous quarter. Of the 50 states and Washington, DC, 44 states either had no change or saw declines in the foreclosure inventory rate.
"While the overall foreclosure inventory rate for the first quarter was considerably lower than the peak of 4.64 percent at the worst of the crisis, it was still above the average of 1.5 percent for the time period between 1979 and the first quarter of 2016. The good news is that foreclosure inventory rates continued to decline in both judicial and non-judicial states this quarter. However, about two-thirds of the twenty states with foreclosure inventory rates above the national average were judicial states."
 Click on graph for larger image.
This graph shows the percent of loans delinquent by days past due.
The percent of loans 30 and 60 days delinquent ticked up a little in Q1, but is still below the normal historical level.
The 90 day bucket declined further in Q1, but remains a little elevated.
The percent of loans in the foreclosure process continues to decline, and is still above the historical average.
The 90 day bucket and foreclosure inventory are still elevated, but should be close to normal at the end of 2016 or in early 2017. Most other mortgage measures are already back to normal, but the lenders are still working through the backlog of bubble legacy loans.

