by Calculated Risk on 12/02/2015 08:20:00 AM
Wednesday, December 02, 2015
ADP: Private Employment increased 217,000 in November
Private sector employment increased by 217,000 jobs from October to November according to the November ADP National Employment Report®. ... The report, which is derived from ADP’s actual payroll data, measures the change in total nonfarm private employment each month on a seasonally-adjusted basis.This was above the consensus forecast for 183,000 private sector jobs added in the ADP report.
...
Goods-producing employment rose by 13,000 jobs in November, down from 22,000 the previous month. The construction industry added 16,000 jobs after gaining over 30,000 in each of the two previous months. Meanwhile, manufacturing rebounded from two straight months of shedding jobs to add 6,000 in November.
Service-providing employment rose by 204,000 jobs in November, a strong increase from an upwardly revised 174,000 in October. ...
Mark Zandi, chief economist of Moody’s Analytics, said, “Job growth remains strong and steady. The current pace of job creation is twice that needed to absorb growth in the working age population. The economy is fast approaching full employment and will be there no later than next summer.”
The BLS report for November will be released Friday, and the consensus is for 190,000 non-farm payroll jobs added in November.
MBA: Mortgage Applications Decrease in Latest MBA Weekly Survey, Purchase Applications up 30% YoY
by Calculated Risk on 12/02/2015 07:02:00 AM
From the MBA: Mortgage Applications Slightly Decrease in Latest MBA Weekly Survey
Mortgage applications decreased 0.2 percent from one week earlier, according to data from the Mortgage Bankers Association’s (MBA) Weekly Mortgage Applications Survey for the week ending November 27, 2015. This week’s results included an adjustment for the Thanksgiving holiday.
...
The Refinance Index decreased 6 percent from the previous week. The seasonally adjusted Purchase Index increased 8 percent from one week earlier. The unadjusted Purchase Index decreased 28 percent compared with the previous week and was 30 percent higher than the same week one year ago.
The average contract interest rate for 30-year fixed-rate mortgages with conforming loan balances ($417,000 or less) decreased to 4.12 percent from 4.14 percent, with points increasing to 0.50 from 0.49 (including the origination fee) for 80 percent loan-to-value ratio (LTV) loans.
emphasis added
 Click on graph for larger image.
The first graph shows the refinance index.
Refinance activity remains low.
2014 was the lowest year for refinance activity since year 2000, and refinance activity will probably stay low for the rest of 2015.
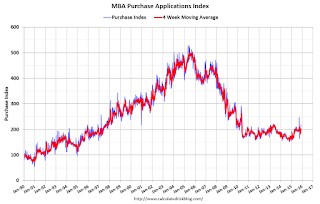
 The second graph shows the MBA mortgage purchase index.
 According to the MBA, the unadjusted purchase index is 30% higher than a year ago.
Tuesday, December 01, 2015
Wednesday: Yellen Speech, ADP Employment, Beige Book
by Calculated Risk on 12/01/2015 08:16:00 PM
An excerpt from Tim Duy at Fed Watch: The Final Countdown
Bottom Line: Just how data-dependent is the Fed when it comes to December? Not much, I think. They are likely just looking for evidence that basic labor market trends remain intact to justify pulling the pin on higher rates. Absent any sharp financial disruptions or disastrous data, it looks like we are on the final countdown to the first rate hike of this cycle. Beyond that, they will proceed very cautiously; this is especially the case if they don’t see evidence of still-declining slack in the form of rising wages and inflation. And if the economy turns choppy as the drivers of recent growth loose their momentum, policy will turn choppy as well. Indeed, in such an environment, future rate hikes would likely comes in fits and starts. Thus while 100bp of tightening is a reasonable baseline for next year, the path is not likely to be a smooth 25bp every other meeting. That will likely pose some interesting communications challenges for the Fed.Wednesday:
emphasis added
• At 10:00 AM ET, The Mortgage Bankers Association (MBA) will release the results for the mortgage purchase applications index.
• At 8:15 AM, The ADP Employment Report for November. This report is for private payrolls only (no government). The consensus is for 183,000 payroll jobs added in November, up from 182,000 in October.
• At 12:25 PM, Speech by Fed Chair Janet Yellen, Economic Outlook, At the Economic Club of Washington, Washington, D.C.
• At 2:00 PM, the Federal Reserve Beige Book, an informal review by the Federal Reserve Banks of current economic conditions in their Districts.
U.S. Light Vehicle Sales at 18.2 million annual rate in November
by Calculated Risk on 12/01/2015 03:00:00 PM
Based on a preliminary WardsAuto estimate, light vehicle sales were at a 18.18 million SAAR in November.
NOTE: Daimler is expected to report tomorrow.
That is up about 7% from October 2014, and up slightly from the 18.13 million annual sales rate last month.
This was the third consecutive month over 18 million.
Click on graph for larger image.
This graph shows the historical light vehicle sales from the BEA (blue) and an estimate for November (red, light vehicle sales of 18.18 million SAAR from WardsAuto).
This was above the consensus forecast of 18.0 million SAAR (seasonally adjusted annual rate).
The second graph shows light vehicle sales since the BEA started keeping data in 1967.
Note: dashed line is current estimated sales rate.
This was another very strong month for auto sales and it appears 2015 will be the one of the best years ever for light vehicle sales.
Construction Spending increased 1.0% in October, Up 13% YoY
by Calculated Risk on 12/01/2015 01:31:00 PM
The Census Bureau reported that overall construction spending increased in October:
The U.S. Census Bureau of the Department of Commerce announced today that construction spending during October 2015 was estimated at a seasonally adjusted annual rate of $1,107.4 billion, 1.0 percent above the revised September estimate of $1,096.6 billion. The October figure is 13.0 percent above the October 2014 estimate of $979.6 billion.Both private spending and public spending increased:
During the first 10 months of this year, construction spending amounted to $888.1 billion, 10.7 percent above the $802.3 billion for the same period in 2014.
Spending on private construction was at a seasonally adjusted annual rate of $802.4 billion, 0.8 percent above the revised September estimate of $795.8 billion. ...
In October, the estimated seasonally adjusted annual rate of public construction spending was $304.9 billion, 1.4 percent above the revised September estimate of $300.8 billion.
emphasis added
This graph shows private residential and nonresidential construction spending, and public spending, since 1993. Note: nominal dollars, not inflation adjusted.
Private residential spending has been increasing, but is 41% below the bubble peak.
Non-residential spending is only 3% below the peak in January 2008 (nominal dollars).
Public construction spending is now 6% below the peak in March 2009 and about 15% above the post-recession low.
On a year-over-year basis, private residential construction spending is up 17%. Non-residential spending is up 15% year-over-year. Public spending is up 6% year-over-year.
Looking forward, all categories of construction spending should increase this year and in 2016. Residential spending is still very low, non-residential is increasing (except oil and gas), and public spending has also increasing after several years of austerity.
This was above the consensus forecast of a 0.6% increase, also spending for August and September were revised up. Another solid construction report.
CoreLogic: House Prices up 6.8% Year-over-year in October
by Calculated Risk on 12/01/2015 11:25:00 AM
Notes: This CoreLogic House Price Index report is for October. The recent Case-Shiller index release was for September. The CoreLogic HPI is a three month weighted average and is not seasonally adjusted (NSA).
From CoreLogic: CoreLogic US Home Price Report Shows Home Prices Up 6.8 Percent Year Over Year in October
Home prices nationwide, including distressed sales, increased by 6.8 percent in October 2015 compared with October 2014 and increased by 1.0 percent in October 2015 compared with September 2015, according to the CoreLogic HPI.
“Many markets have experienced a low inventory of homes for sale along with strong buyer demand, which is sustaining upward pressure on home prices. These conditions are likely to persist as we enter 2016,” said Dr. Frank Nothaft, chief economist for CoreLogic. “A year from now, as we finish out October 2016, we expect the CoreLogic national Home Price Index appreciation to slow to 5.2 percent.”
“The rise in home prices over the past few years has largely been a healthy trend. The shadow inventory has been reduced significantly and home equity levels are now approaching pre-recession levels,” said Anand Nallathambi, president and CEO of CoreLogic. “As we move forward, the rise in home prices will need to be better correlated to family income trends over time to avoid homes becoming unaffordable for many. This is especially true in several metropolitan areas where home prices have grown rapidly.”
emphasis added
This graph shows the national CoreLogic HPI data since 1976. January 2000 = 100.
The index was up 1.0% in October (NSA), and is up 6.8% over the last year.
This index is not seasonally adjusted, and this was a solid month-to-month increase.
The second graph shows the YoY change in nominal terms (not adjusted for inflation).
The year-over-year comparison has been positive for forty four consecutive months.
ISM Manufacturing index decreased to 48.6 in November
by Calculated Risk on 12/01/2015 10:08:00 AM
The ISM manufacturing index indicated contraction in November. The PMI was at 48.6% in November, down from 50.1% in October. The employment index was at 51.3%, up from 47.6% in October, and the new orders index was at 48.9%, down from 52.9%.
From the Institute for Supply Management: November 2015 Manufacturing ISM® Report On Business®
Economic activity in the manufacturing sector contracted in November for the first time in 36 months, since November 2012, while the overall economy grew for the 78th consecutive month, say the nation’s supply executives in the latest Manufacturing ISM® Report On Business®.
The report was issued today by Bradley J. Holcomb, CPSM, CPSD, chair of the Institute for Supply Management® (ISM®) Manufacturing Business Survey Committee. "The November PMI® registered 48.6 percent, a decrease of 1.5 percentage points from the October reading of 50.1 percent. The New Orders Index registered 48.9 percent, a decrease of 4 percentage points from the reading of 52.9 percent in October. The Production Index registered 49.2 percent, 3.7 percentage points below the October reading of 52.9 percent. The Employment Index registered 51.3 percent, 3.7 percentage points above the October reading of 47.6 percent. The Prices Index registered 35.5 percent, a decrease of 3.5 percentage points from the October reading of 39 percent, indicating lower raw materials prices for the 13th consecutive month. The New Export Orders Index registered 47.5 percent, unchanged from October, and the Imports Index registered 49 percent, up 2 percentage points from the October reading of 47 percent. Ten out of 18 manufacturing industries reported contraction in November, with lower new orders, production and raw materials inventories accounting for the overall softness in November."
emphasis added
Here is a long term graph of the ISM manufacturing index.
This was below expectations of 50.5%, and indicates manufacturing contracted in November.
Monday, November 30, 2015
Tuesday: ISM Manufacturing, Construction Spending, Auto Sales
by Calculated Risk on 11/30/2015 09:04:00 PM
From the LA Times: After subprime collapse, nonbank lenders again dominate riskier mortgages
So-called nonbank lenders are again dominating a riskier corner of the housing market — this time, loans insured by the Federal Housing Administration, aimed at first-time and bad-credit buyers. Such lenders now control 64% of the market for FHA and similar Veterans Affairs loans, compared with 18% in 2010.This is probably not a serious problem, but additional oversight makes sense.
A Times analysis of federal loan data shows that FHA mortgages from nonbank lenders are seeing more delinquencies than similar loans from banks.
...
"The idea that a lot of the folks who benefited during subprime are now back in action calls out for closer scrutiny," said Kevin Stein, associate director of the California Reinvestment Coalition, a fair-lending advocacy group in San Francisco.
The surge in nonbank lending also has prompted alarm at Ginnie Mae, a government corporation that monitors FHA and VA lenders. Ginnie Mae's president, Ted Tozer, has requested $5 million in additional federal funding to hire 33 additional regulators.
"These firms have grown so fast," he said.
Tuesday:
• At 10:00 AM ET, ISM Manufacturing Index for November. The consensus is for the ISM to be at 50.5, up from 50.1 in October. The employment index was at 47.6% in October, and the new orders index was at 52.9%.
• Also at 10:00 AM, Construction Spending for October. The consensus is for a 0.6% increase in construction spending.
• All day: Light vehicle sales for November. The consensus is for light vehicle sales to decrease to 18.0 million SAAR in November from 18.1 million in October (Seasonally Adjusted Annual Rate).
Fannie Mae: Mortgage Serious Delinquency rate declined slightly in October
by Calculated Risk on 11/30/2015 04:06:00 PM
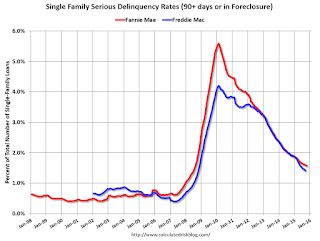
Fannie Mae reported today that the Single-Family Serious Delinquency rate declined slightly in October to 1.58% from 1.59% in September. The serious delinquency rate is down from 1.92% in October 2014, and this is the lowest level since August 2008.
The Fannie Mae serious delinquency rate peaked in February 2010 at 5.59%.
Note: These are mortgage loans that are "three monthly payments or more past due or in foreclosure".
Note: Freddie Mac has not reported for October yet.

The Fannie Mae serious delinquency rate has only fallen 0.34 percentage points over the last year - the pace of improvement has slowed - and at that pace the serious delinquency rate will not be below 1% until 2017.
The "normal" serious delinquency rate is under 1%, so maybe Fannie Mae serious delinquencies will be close to normal some time in 2017. This elevated delinquency rate is mostly related to older loans - the lenders are still working through the backlog.
Restaurant Performance Index indicates faster expansion in October
by Calculated Risk on 11/30/2015 12:31:00 PM
Here is a minor indicator I follow from the National Restaurant Association: Restaurant Performance Index Rose in October
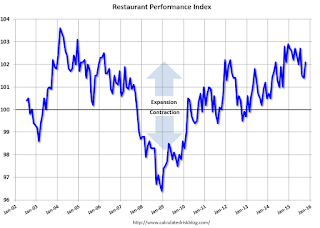
Driven by stronger same-store sales and a more optimistic outlook among restaurant operators, the National Restaurant Association’s Restaurant Performance Index (RPI) posted a moderate gain in October. The RPI – a monthly composite index that tracks the health of and outlook for the U.S. restaurant industry – stood at 102.1 in October, up 0.7 percent from a level of 101.4 in September. In addition, October represented the 32nd consecutive month in which the RPI stood above 100, which signifies expansion in the index of key industry indicators.
...
“The October gain in the RPI was buoyed by broad-based improvements in the current situation indicators,” said Hudson Riehle, senior vice president of the Research and Knowledge Group for the Association. “In addition, restaurant operators are somewhat more optimistic about both sales growth and the economy in the months ahead.”
emphasis added
 Click on graph for larger image.
The index increased to 102.1 in October, down from 101.4 in September. (above 100 indicates expansion).
Restaurant spending is discretionary, so even though this is "D-list" data, I like to check it every month. This index is indicated decent expansion in October, and it appears restaurants are benefiting from lower gasoline prices and the improved labor market.


