 RSS Feed
 by Calculated Risk on 10/20/2015 10:43:00 AM
Tuesday, October 20, 2015
BLS: Thirty-seven States had Unemployment Rate Decreases in September
From the BLS: Regional and State Employment and Unemployment Summary
Regional and state unemployment rates were little changed in September. Thirty-seven states and the District of Columbia had unemployment rate decreases from August, six states had increases, and seven states had no change, the U.S. Bureau of Labor Statistics reported today.
...
North Dakota had the lowest jobless rate in September, 2.8 percent, followed by Nebraska, 2.9 percent. West Virginia had the highest rate, 7.3 percent.
 Click on graph for larger image.
This graph shows the current unemployment rate for each state (red), and the max during the recession (blue). All states are well below the maximum unemployment rate for the recession.
The size of the blue bar indicates the amount of improvement. The yellow squares are the lowest unemployment rate per state since 1976.
The states are ranked by the highest current unemployment rate. West Virginia, at 7.3%, had the highest state unemployment rate.
 The second graph shows the number of states (and D.C.) with unemployment rates at or above certain levels since January 2006. At the worst of the employment recession, there were 10 states with an unemployment rate at or above 11% (red).
Currently no state has an unemployment rate at or above 8% (purple); Only one state (West Virginia) was at or above 7% (light blue), and ten states are at or above 6% (dark blue).
Housing Starts increased to 1.206 Million Annual Rate in September
by Calculated Risk on 10/20/2015 08:39:00 AM
From the Census Bureau: Permits, Starts and Completions
Housing Starts:
Privately-owned housing starts in September were at a seasonally adjusted annual rate of 1,206,000. This is 6.5 percent above the revised August estimate of 1,132,000 and is 17.5 percent above the September 2014 rate of 1,026,000.
Single-family housing starts in September were at a rate of 740,000; this is 0.3 percent above the revised August figure of 738,000. The September rate for units in buildings with five units or more was 454,000.
Building Permits:
Privately-owned housing units authorized by building permits in September were at a seasonally adjusted annual rate of 1,103,000. This is 5.0 percent below the revised August rate of 1,161,000, but is 4.7 percent above the September 2014 estimate of 1,053,000.
Single-family authorizations in September were at a rate of 697,000; this is 0.3 percent below the revised August figure of 699,000. Authorizations of units in buildings with five units or more were at a rate of 369,000 in September.
emphasis added
 Click on graph for larger image.
The first graph shows single and multi-family housing starts for the last several years.
Multi-family starts (red, 2+ units) increased in September. Multi-family starts were up sharply year-over-year.
Single-family starts (blue) increased in September and are up about 12% year-over-year.
The second graph shows total and single unit starts since 1968.
 The second graph shows the huge collapse following the housing bubble, and then - after moving sideways for a couple of years - housing is now recovering (but still historically low),
Total housing starts in September were above expectations, and starts were mostly unchanged for July and August. I'll have more later ...
Monday, October 19, 2015
Tuesday: Housing Starts
by Calculated Risk on 10/19/2015 06:48:00 PM
From Matthew Graham at Mortgage News Daily: Mortgage Rates Quietly Holding Near Lows
Most lenders continue to quote conventional 30yr fixed rates in the 3.75% to 3.875% range. Any changes from yesterday would be seen in the form of microscopic adjustments to the upfront cost/credit (as opposed to the "note rate" itself). Apart from October 2nd, today's rates sheets are right in line with the recent run of 5-month lows.Tuesday:
emphasis added
• At 8:30 AM ET, Housing Starts for September. Total housing starts decreased to 1.126 million (SAAR) in August. Single family starts decreased to 739 thousand SAAR in August. The consensus for 1.147 million, up from August.
• At 10:00 AM, Regional and State Employment and Unemployment for September.
Lawler: Preliminary Table of Distressed Sales and Cash buyers for Selected Cities in September
by Calculated Risk on 10/19/2015 02:34:00 PM
Economist Tom Lawler sent me a preliminary table below of short sales, foreclosures and cash buyers for a few selected cities in September.
On distressed: Total "distressed" share is down in most of these markets. Distressed sales are up in the Baltimore due to an increase in foreclosures.
Short sales are down in all of these areas.
The All Cash Share (last two columns) is declining year-over-year. As investors pull back, the share of all cash buyers will probably continue to decline.
| Short Sales Share | Foreclosure Sales Share | Total "Distressed" Share | All Cash Share | |||||
|---|---|---|---|---|---|---|---|---|
| Sep- 2015 | Sep- 2014 | Sep- 2015 | Sep- 2014 | Sep- 2015 | Sep- 2014 | Sep- 2015 | Sep- 2014 | |
| Las Vegas | 6.8% | 10.4% | 7.1% | 8.8% | 13.9% | 19.2% | 26.8% | 34.3% |
| Reno** | 3.0% | 7.0% | 3.0% | 7.0% | 6.0% | 14.0% | ||
| Phoenix | 2.4% | 3.8% | 3.5% | 5.8% | 5.9% | 9.6% | 22.5% | 25.7% |
| Sacramento | 2.9% | 5.3% | 4.1% | 5.3% | 6.9% | 10.7% | 17.6% | 19.4% |
| Minneapolis | 1.8% | 3.4% | 6.5% | 9.6% | 8.3% | 13.0% | ||
| Mid-Atlantic | 3.9% | 5.5% | 11.1% | 9.7% | 14.9% | 15.2% | 17.5% | 19.1% |
| Baltimore MSA**** | 4.3% | 5.6% | 18.6% | 15.4% | 22.9% | 21.0% | ||
| Orlando | 3.5% | 7.1% | 20.1% | 24.8% | 23.6% | 31.8% | 35.6% | 41.7% |
| Chicago (city) | 17.5% | 18.8% | ||||||
| Hampton Roads | 15.6% | 19.6% | ||||||
| Spokane | 7.8% | 12.6% | ||||||
| Northeast Florida | 23.8% | 29.7% | ||||||
| Chicago (city) | 17.5% | 18.8% | ||||||
| Colorado***** | 1.8% | 3.7% | ||||||
| Toledo | 26.5% | 31.4% | ||||||
| Tucson | 25.9% | 26.7% | ||||||
| Georgia*** | 22.3% | 27.4% | ||||||
| Omaha | 18.1% | 19.9% | ||||||
| Pensacola | 31.4% | 29.2% | ||||||
| Tucson | 25.9% | 26.7% | ||||||
| Richmond MSA | 10.5% | 11.7% | 15.2% | 18.4% | ||||
| Memphis* | 13.1% | 13.2% | ||||||
| Springfield IL** | 10.1% | 9.5% | ||||||
| *share of existing home sales, based on property records **Single Family Only ***GAMLS ****Baltimore is included in the Mid-Atlantic region, but is shown separately here *****As tabulated by the Colorado Association of Realtors | ||||||||
Ornithology: What is a "deficit hawk"?
by Calculated Risk on 10/19/2015 01:27:00 PM
Nick Timiraos wrote yesterday in the WSJ: Debt, Growth Concerns Rain on Deficit Parade
The U.S. budget deficit is lower than before the 2008 financial crisis. But the good news is tempered by concerns on two fronts, one about the nation’s debt load and the other about the economy.I'd like to see the definition of a "deficit hawk"!
Deficit hawks are concerned that the improvement will lead both parties to overlook the red ink set to rise later this decade from a surge in spending on health care and retirement benefits for the baby-boom generation.
They worry that while the deficit is at the lowest level since 2007, the U.S. has added nearly $8 trillion in debt, an increase of 140%. That has nearly doubled the nation’s debt-to-GDP ratio, which stands near 73%—based on federal debt held by the public—and isn’t projected to fall in the coming years.
I'd think a true deficit hawk would be truly concerned about, uh, the deficit. So they'd support both tax increases1 and spending cuts to reduce the deficit. They'd oppose policies that increase the deficit (like the Bush tax cuts, and the war in Iraq). They'd also be concerned about policies that led to the financial crisis and a deep recession - since the deficit increases during a recession.
Maybe I'm talking my own position since I opposed the Bush tax cuts (that created a structural deficit). I opposed the Iraq war. I frequently talked to regulators about lax lending in real estate (and posted some of those discussion on this blog in 2005) that led directly to the financial crisis and large deficits. And I support both intelligent tax increases and spending cuts.
Unfortunately, my experience is that most people who claims to be "deficit hawks", are really pushing a different agenda. I wish Timiraos would provide a few examples of deficit hawks!
Also the "red ink set to rise later this decade" is expected in increase the deficit from 2.5% of GDP to about 3.1% in 2020.
1 Note: Some people like to focus on "growth" to reduce the deficit, and they tend to focus on tax cuts to boost growth. However, all data and research shows that at the current marginal rates, tax cuts do not pay for themselves and lead to much larger deficits.
NAHB: Builder Confidence at 64 in October, Highest in 10 Years
by Calculated Risk on 10/19/2015 10:06:00 AM
The National Association of Home Builders (NAHB) reported the housing market index (HMI) was at 64 in October, up from 61 in September. Any number above 50 indicates that more builders view sales conditions as good than poor.
From the NAHB: Builder Confidence Rises Three Points in October
Builder confidence in the market for newly constructed single-family homes rose three points in October to a level of 64 on the National Association of Home Builders/Wells Fargo Housing Market Index (HMI). This month’s reading is a return to HMI levels seen at the end of the housing boom in late 2005.
...
“With October’s three-point uptick, builder confidence has been holding steady or increasing for five straight months. This upward momentum shows that our industry is strengthening at a gradual but consistent pace,” said NAHB Chief Economist David Crowe. “With firm job creation, economic growth and the release of pent-up demand, we expect housing to keep moving forward as we start to close out 2015.”
...
Two of the three HMI components posted gains in October. The index measuring sales expectations in the next six months rose seven points to 75, and the component gauging current sales conditions increased three points to 70. Meanwhile, the index charting buyer traffic held steady at 47.
Looking at the three-month moving averages for regional HMI scores, all four regions posted gains. The West registered a five-point uptick to 69 while the Northeast, Midwest and South each rose one point to 47, 60 and 65, respectively.
emphasis added
 Click on graph for larger image.
This graph show the NAHB index since Jan 1985.
This was above the consensus forecast of 62.
Sunday, October 18, 2015
Sunday Night Futures
by Calculated Risk on 10/18/2015 09:17:00 PM
Weekend:
• Schedule for Week of October 18, 2015
Monday:
• At 10:00 AM, the October NAHB homebuilder survey. The consensus is for a reading of 62, unchanged from September. Any number above 50 indicates that more builders view sales conditions as good than poor.
From CNBC: Pre-Market Data and Bloomberg futures: currently S&P futures and DOW futures are mostly unchanged (fair value).
Oil prices were down over the last week with WTI futures at $47.31 per barrel and Brent at $50.50 per barrel. A year ago, WTI was at $82, and Brent was at $85 - so prices are down about 40% year-over-year (It was a year ago that prices were falling sharply).
Here is a graph from Gasbuddy.com for nationwide gasoline prices. Nationally prices are at $2.26 per gallon (down about $0.75 per gallon from a year ago).
Goldman Sachs Expects "Fed Liftoff" in December
by Calculated Risk on 10/18/2015 09:46:00 AM
A few excerpts from a research piece by Goldman Sachs chief economist Jan Hatzius: Q&A on Fed Liftoff
We still expect a rate hike at the December FOMC meeting. The leadership has signaled that such a move is likely if the economy and markets evolve broadly as expected, and our forecast is similar to theirs. However, we are only about 60% confident. Most of the uncertainty relates to the possibility that the economic and market environment—or in a broad sense, “the data”—will be worse than the FOMC’s (and our) expectations.
...
The low market-implied probability of a December hike of only 30%-40% probably reflects a mixture of concerns about the data (which we find reasonable) and a belief among some market participants that the FOMC will find an “excuse” to stay on hold even if the economy does fine (which we find unreasonable). ...
Our own view is that it might make sense to start normalizing in December if we were perfectly confident in our baseline forecast for the economy. But uncertainty around that forecast still argues for waiting longer. The main reason is risk management.
Saturday, October 17, 2015
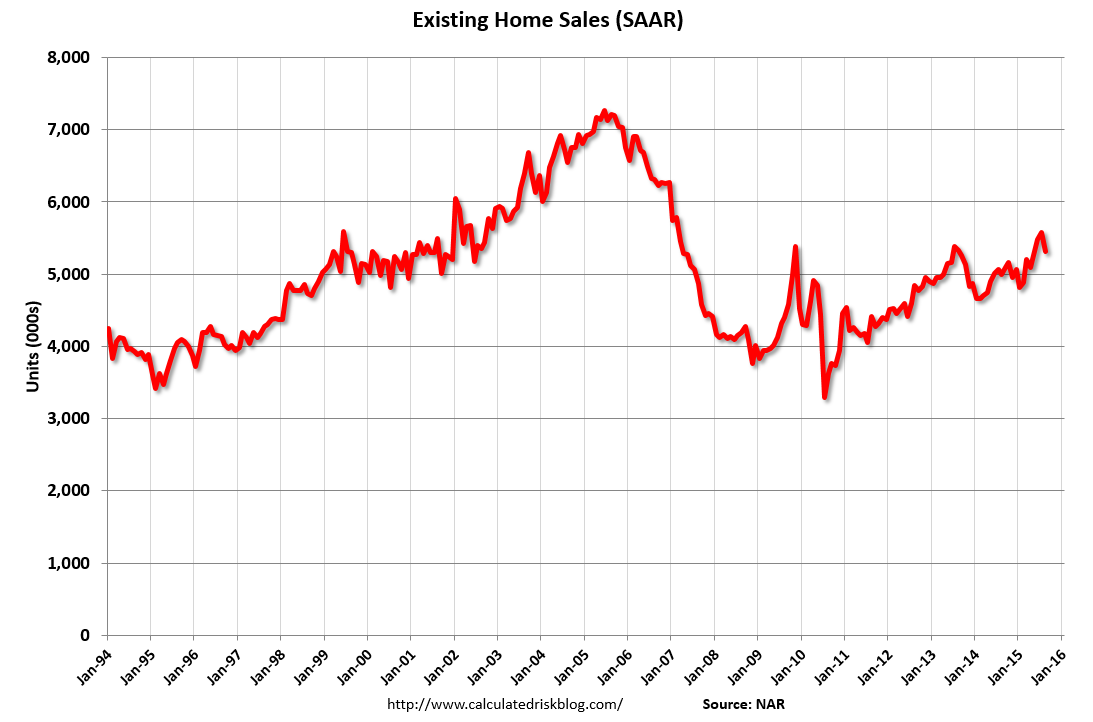
Existing Home Sales: Lawler vs. the Consensus
by Calculated Risk on 10/17/2015 04:01:00 PM
The NAR will report September Existing Home Sales on Thursday, October 22nd at 10:00 AM.
The consensus, according to Bloomberg, is that the NAR will report sales of 5.35 million. Housing economist Tom Lawler estimates the NAR will report sales of 5.56 million on a seasonally adjusted annual rate (SAAR) basis, up from 5.31 million SAAR in August.
Housing economist Tom Lawler has been sending me his predictions of what the NAR will report for over 5 years. The table below shows the consensus for each month, Lawler's predictions, and the NAR's initial reported level of sales.
Lawler hasn't always been closer than the consensus, but usually when there has been a fairly large spread between Lawler's estimate and the "consensus", Lawler has been closer.
NOTE: There have been times when Lawler "missed", but then he pointed out an apparent error in the NAR data - and the subsequent revision corrected that error. As an example, see: The “Curious Case” of Existing Home Sales in the South in April
Over the last five years, the consensus average miss was 146 thousand with a standard deviation of 150 thousand. Lawler's average miss was 69 thousand with a standard deviation of 50 thousand.
NOTE: Last month was Lawler's largest miss by 0.23 million SAAR (read his explanation here). For comparison, the consensus' largest miss was 0.83 million. Ouch.
Many analysts now change their "forecast" after Lawler's estimate is posted, so the consensus has improved a little recently!
| Existing Home Sales, Forecasts and NAR Report millions, seasonally adjusted annual rate basis (SAAR) | |||
|---|---|---|---|
| Month | Consensus | Lawler | NAR reported1 |
| May-10 | 6.20 | 5.83 | 5.66 |
| Jun-10 | 5.30 | 5.30 | 5.37 |
| Jul-10 | 4.66 | 3.95 | 3.83 |
| Aug-10 | 4.10 | 4.10 | 4.13 |
| Sep-10 | 4.30 | 4.50 | 4.53 |
| Oct-10 | 4.50 | 4.46 | 4.43 |
| Nov-10 | 4.85 | 4.61 | 4.68 |
| Dec-10 | 4.90 | 5.13 | 5.28 |
| Jan-11 | 5.20 | 5.17 | 5.36 |
| Feb-11 | 5.15 | 5.00 | 4.88 |
| Mar-11 | 5.00 | 5.08 | 5.10 |
| Apr-11 | 5.20 | 5.15 | 5.05 |
| May-11 | 4.75 | 4.80 | 4.81 |
| Jun-11 | 4.90 | 4.71 | 4.77 |
| Jul-11 | 4.92 | 4.69 | 4.67 |
| Aug-11 | 4.75 | 4.92 | 5.03 |
| Sep-11 | 4.93 | 4.83 | 4.91 |
| Oct-11 | 4.80 | 4.86 | 4.97 |
| Nov-11 | 5.08 | 4.40 | 4.42 |
| Dec-11 | 4.60 | 4.64 | 4.61 |
| Jan-12 | 4.69 | 4.66 | 4.57 |
| Feb-12 | 4.61 | 4.63 | 4.59 |
| Mar-12 | 4.62 | 4.59 | 4.48 |
| Apr-12 | 4.66 | 4.53 | 4.62 |
| May-12 | 4.57 | 4.66 | 4.55 |
| Jun-12 | 4.65 | 4.56 | 4.37 |
| Jul-12 | 4.50 | 4.47 | 4.47 |
| Aug-12 | 4.55 | 4.87 | 4.82 |
| Sep-12 | 4.75 | 4.70 | 4.75 |
| Oct-12 | 4.74 | 4.84 | 4.79 |
| Nov-12 | 4.90 | 5.10 | 5.04 |
| Dec-12 | 5.10 | 4.97 | 4.94 |
| Jan-13 | 4.90 | 4.94 | 4.92 |
| Feb-13 | 5.01 | 4.87 | 4.98 |
| Mar-13 | 5.03 | 4.89 | 4.92 |
| Apr-13 | 4.92 | 5.03 | 4.97 |
| May-13 | 5.00 | 5.20 | 5.18 |
| Jun-13 | 5.27 | 4.99 | 5.08 |
| Jul-13 | 5.13 | 5.33 | 5.39 |
| Aug-13 | 5.25 | 5.35 | 5.48 |
| Sep-13 | 5.30 | 5.26 | 5.29 |
| Oct-13 | 5.13 | 5.08 | 5.12 |
| Nov-13 | 5.02 | 4.98 | 4.90 |
| Dec-13 | 4.90 | 4.96 | 4.87 |
| Jan-14 | 4.70 | 4.67 | 4.62 |
| Feb-14 | 4.64 | 4.60 | 4.60 |
| Mar-14 | 4.56 | 4.64 | 4.59 |
| Apr-14 | 4.67 | 4.70 | 4.65 |
| May-14 | 4.75 | 4.81 | 4.89 |
| Jun-14 | 4.99 | 4.96 | 5.04 |
| Jul-14 | 5.00 | 5.09 | 5.15 |
| Aug-14 | 5.18 | 5.12 | 5.05 |
| Sep-14 | 5.09 | 5.14 | 5.17 |
| Oct-14 | 5.15 | 5.28 | 5.26 |
| Nov-14 | 5.20 | 4.90 | 4.93 |
| Dec-14 | 5.05 | 5.15 | 5.04 |
| Jan-15 | 5.00 | 4.90 | 4.82 |
| Feb-15 | 4.94 | 4.87 | 4.88 |
| Mar-15 | 5.04 | 5.18 | 5.19 |
| Apr-15 | 5.22 | 5.20 | 5.04 |
| May-15 | 5.25 | 5.29 | 5.35 |
| Jun-15 | 5.40 | 5.45 | 5.49 |
| Jul-15 | 5.41 | 5.64 | 5.59 |
| Aug-15 | 5.50 | 5.54 | 5.31 |
| Sep-15 | 5.35 | 5.56 | --- |
| 1NAR initially reported before revisions. | |||
Schedule for Week of October 18th
by Calculated Risk on 10/17/2015 08:11:00 AM
The key economic reports this week are September housing starts on Tuesday, and September Existing Home Sales on Thursday.
10:00 AM: The October NAHB homebuilder survey. The consensus is for a reading of 62, unchanged from September. Any number above 50 indicates that more builders view sales conditions as good than poor.
 8:30 AM: Housing Starts for September.
 Total housing starts decreased to 1.126 million (SAAR) in August. Single family starts decreased to 739 thousand SAAR in August.
The consensus for 1.147 million, up from August.
10:00 AM ET: Regional and State Employment and Unemployment for September.
7:00 AM ET: The Mortgage Bankers Association (MBA) will release the results for the mortgage purchase applications index.
During the day: The AIA's Architecture Billings Index for September (a leading indicator for commercial real estate).
8:30 AM ET: The initial weekly unemployment claims report will be released. The consensus is for 265 thousand initial claims, up from 255 thousand the previous week.
8:30 AM ET: Chicago Fed National Activity Index for September. This is a composite index of other data.
9:00 AM: FHFA House Price Index for August 2015. This was originally a GSE only repeat sales, however there is also an expanded index. The consensus is for a 0.5% month-to-month increase for this index.
 10:00 AM: Existing Home Sales for September from the National Association of Realtors (NAR). The consensus is for 5.35 million SAAR, up from 5.31 million in August.
 Economist Tom Lawler estimates the NAR will report sales of 5.56 million SAAR.
A key will be the reported year-over-year change in inventory of homes for sale.
11:00 AM: the Kansas City Fed manufacturing survey for September.
During the day: Q3 NMHC Apartment Tightness Index.
No economic released scheduled.


