 RSS Feed
 by Calculated Risk on 5/12/2015 01:11:00 PM
Tuesday, May 12, 2015
NY Fed: Household Debt increased slightly in Q1 2015
Here is the Q1 report: Household Debt and Credit Report.
From the NY Fed: Delinquencies, Foreclosures and Bankruptcies Improve as Household Debt Stays Flat
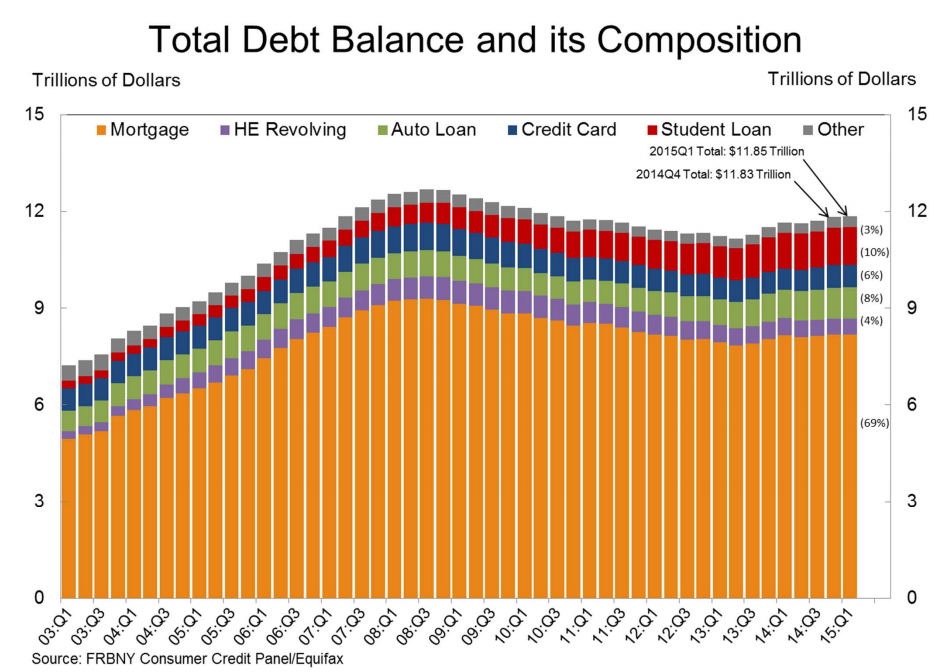
The Federal Reserve Bank of New York’s Household Debt and Credit Report revealed that aggregate household debt balances were largely flat in the first quarter of 2015. As of the end of March, total household indebtedness was $11.85 trillion, a $24 billion, or 0.2 percent, increase during the first quarter of this year. The report is based on data from the New York Fed’s Consumer Credit Panel, a nationally representative sample drawn from anonymized Equifax credit data.
The slowdown in growth can be attributed to a negligible uptick in mortgage balances, which are the largest component of household debt. Mortgage balances stood at $8.17 trillion in the first quarter. Additionally, balances on home equity lines of credit (HELOC), which were $510 billion at the end of fourth quarter, 2014, were unchanged in the first quarter of this year.
Non-housing debt balances increased by 0.7 percent from the end of last year, largely due to increases in student loans ($32 billion) and auto loans ($13 billion). These gains were partially offset by a $16 billion decline in credit card balances.
Measures on delinquencies, foreclosures and bankruptcies all improved in the first quarter. The percentage of outstanding debt in some stage of delinquency fell to 5.7 percent from 6.0 percent in the fourth quarter of 2014, with continuing improvements in mortgages. About 112,000 individuals had a new foreclosure notation added to their credit reports in the first quarter of this year, the lowest total since at least 1999. Four percent fewer consumers had a bankruptcy notation added to their credit reports, bringing the quarterly total to its lowest point since early 2006.
“Tight standards on mortgage lending are reflected in both sluggish growth in housing debt as well as substantial reductions in mortgage delinquency and defaults,“ said Andrew Haughwout, senior vice president and economist at the New York Fed.
emphasis added
 Click on graph for larger image.
Here are two graphs from the report:
The first graph shows aggregate consumer debt increased slightly in Q1. Household debt peaked in 2008, and bottomed in Q2 2013.
The recent increase in debt suggests households (in the aggregate) deleveraging is over.
 The second graph shows the percent of debt in delinquency. The percent of delinquent debt is generally declining, although there is still a large percent of debt 90+ days delinquent (Yellow, orange and red).
 The overall delinquency rate decreased to 5.7% in Q1, from 6.0% in Q4.
There are a number of credit graphs at the NY Fed site.
BLS: Jobs Openings at 5.0 million in March, Up 19% Year-over-year
by Calculated Risk on 5/12/2015 10:09:00 AM
From the BLS: Job Openings and Labor Turnover Summary
There were 5.0 million job openings on the last business day of March, little changed from 5.1 million in February, the U.S. Bureau of Labor Statistics reported today. Hires were little changed at 5.1 million in March and separations were little changed at 5.0 million....The following graph shows job openings (yellow line), hires (dark blue), Layoff, Discharges and other (red column), and Quits (light blue column) from the JOLTS.
...
Quits are generally voluntary separations initiated by the employee. Therefore, the quits rate can serve as a measure of workers’ willingness or ability to leave jobs. ... There were 2.8 million quits in March, little changed from February.
This series started in December 2000.
Note: The difference between JOLTS hires and separations is similar to the CES (payroll survey) net jobs headline numbers. This report is for March, the most recent employment report was for April.
 Click on graph for larger image.
Note that hires (dark blue) and total separations (red and light blue columns stacked) are pretty close each month. This is a measure of labor market turnover. When the blue line is above the two stacked columns, the economy is adding net jobs - when it is below the columns, the economy is losing jobs.
Jobs openings decreased in March to 4.994 million from 5.144 million in February.
The number of job openings (yellow) are up 19% year-over-year compared to March 2014.
Quits are up 14% year-over-year. These are voluntary separations. (see light blue columns at bottom of graph for trend for "quits").
This is another solid report. It is a good sign that job openings are around 5 million, and that quits are increasing solidly year-over-year.
NFIB: Small Business Optimism Index increased in April
by Calculated Risk on 5/12/2015 09:06:00 AM
From the National Federation of Independent Business (NFIB): Small Business Optimism Rises, But Future Sales Cloud Outlook
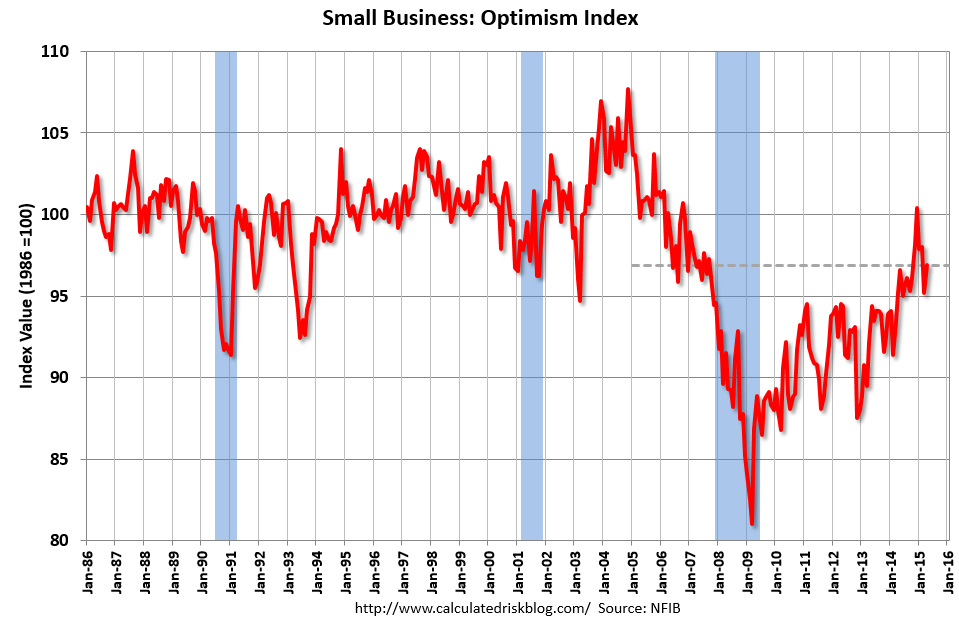
The Small Business Optimism Index increased 1.7 points from March to 96.9, this in spite of a quarter of virtually no economic growth. Unfortunately, the Index remained below the January reading. Nine of the 10 Index components gained, only real sales expectations were weaker. But this still leaves the Index below its historical average, oscillating between 95 and 98 but never breaking out except for December, when the Index just tipped past 100, only to fall again.More good news: Only 11 percent of companies reported "poor sales" as the most important problem, down from 16% a year ago, and a recession high of 34%.
...
Small businesses posted another decent month of job creation. Those that hired were more aggressive than those reducing employment, producing an average increase of 0.14 workers per firm, continuing a string of solid readings for 2015. ... Twenty-seven percent of all owners reported job openings they could not fill in the current period, up 3 points from March. A net 11 percent plan to create new jobs, up 1 point and a solid reading.
emphasis added
 Click on graph for larger image.
This graph shows the small business optimism index since 1986.
The index increased to 96.9 in April from 95.2 in March.
Monday, May 11, 2015
Tuesday: Job Openings, Q1 Household Debt and Credit Report
by Calculated Risk on 5/11/2015 09:27:00 PM
A couple of posts on consumers ...
From Professor Hamilton at Econbrowser: Energy prices and consumer spending
Whatever the explanation, the facts seem to be that, unlike what we usually observed historically, consumers have been using much of the gains from lower energy prices to bolster their saving rather than using it to increase spending on other goods and services.And from Dr. Altig at Macroblog: All Eyes on the Consumer
... the "fundamentals" suggest the four-month annualized growth of consumer spending should have been in excess of 4 percent, as opposed to the approximately 1.5 percent we actually saw. That is a story we don't expect to persist, and our current view of the year is that first-quarter consumer spending results are not indicative of future performance.My sense is the increase in consumer spending will be larger in Q2.
Consumers are, of course, a forward-looking bunch, and it is possible the recent weak spending reflects a looming reality not captured by the simple model described above. But our forecast for now is that consumers will move to the fundamentals, and not vice versa.
Tuesday:
• At 9:00 AM ET, NFIB Small Business Optimism Index for April.
• At 10:00 AM, the Job Openings and Labor Turnover Survey for March from the BLS. Jobs openings increased in February to 5.133 million from 4.965 million in January. This was the highest level for job openings since January 2001. The number of job openings (yellow) were up 23% year-over-year, and Quits were up 10% year-over-year.
• At 11:00 AM, the The New York Fed will release their Q1 2015 Household Debt and Credit Report
Research: Natural Rate of Unemployment under 5% and Falling
by Calculated Risk on 5/11/2015 05:32:00 PM
From the Chicago Fed: Changing labor force composition and the natural rate of unemployment Excerpts:
We estimate our baseline natural rate of unemployment as of 2014:Q4 to be 4.9% —0.5 percentage points lower than the CBO’s estimate of the short-run natural rate. We project this rate to fall by about 0.06 percentage points per year through the end of the decade, reaching 4.5% at the end of 2020—0.7 percentage points below the CBO’s estimate.
Two broad assumptions underlie these simple calculations. First, demographics and educational attainment are fundamental determinants of unemployment, and thus, changes in them over time should drive overall levels of aggregate unemployment. Second, the unemployment rate was at its natural rate in late 2005. Both of these assumptions seem plausible, but neither is completely unassailable. ...
...
While great progress has been made over the past few years, significant labor market slack remains. We estimate the natural rate at or below 5%, at least half of a percentage point below its actual level as of March 2015. This estimate of slack, in combination with labor market measures such as LFP and involuntary part-time workers, may help explain why wage inflation and price inflation remain so low. Moreover, we estimate that absent major new developments, demographic and educational changes will persist, potentially reducing the trend unemployment rate to around 4.4% to 4.8% by 2020.


