by Calculated Risk on 4/28/2015 01:45:00 PM
Tuesday, April 28, 2015
HVS: Q1 2015 Homeownership and Vacancy Rates
The Census Bureau released the Residential Vacancies and Homeownership report for Q1 2015.
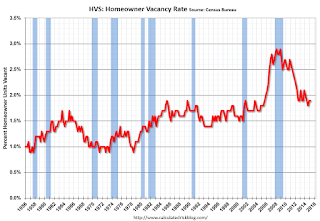
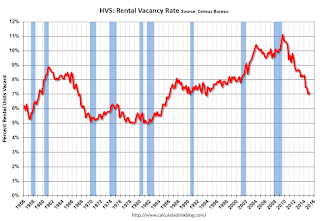
This report is frequently mentioned by analysts and the media to track household formation, the homeownership rate, and the homeowner and rental vacancy rates. However, there are serious questions about the accuracy of this survey.
This survey might show the trend, but I wouldn't rely on the absolute numbers. The Census Bureau is investigating the differences between the HVS, ACS and decennial Census, and analysts probably shouldn't use the HVS to estimate the excess vacant supply or household formation, or rely on the homeownership rate, except as a guide to the trend.

The Red dots are the decennial Census homeownership rates for April 1st 1990, 2000 and 2010. The HVS homeownership rate decreased to 63.7% in Q1, from 64.0% in Q4.
I'd put more weight on the decennial Census numbers - and given changing demographics, the homeownership rate is probably close to a bottom.

Are these homes becoming rentals?
Once again - this probably shows the general trend, but I wouldn't rely on the absolute numbers.

I think the Reis quarterly survey (large apartment owners only in selected cities) is a much better measure of the rental vacancy rate.
The quarterly HVS is the most timely survey on households, but there are many questions about the accuracy of this survey.
Richmond Fed: "Manufacturing Sector Activity Remained Soft"
by Calculated Risk on 4/28/2015 10:22:00 AM
From the Richmond Fed: Manufacturing Sector Activity Remained Soft; Employment and Wages Grew Mildly
Overall, manufacturing conditions remained soft in April. The composite index for manufacturing moved to a reading of −3 following last month's reading of −8. The index for shipments and the index for new orders gained seven points in April, although both indicators finished at only −6.This is the last of the regional surveys for April. Here is a graph comparing the regional Fed surveys and the ISM manufacturing index:
Manufacturing employment edged up a point this month, with the index ending at 7. The average workweek lengthened, moving the index up eight points to end at 4. The average wage index added one point to end at 9.
emphasis added
 Click on graph for larger image.
The New York and Philly Fed surveys are averaged together (yellow, through April), and five Fed surveys are averaged (blue, through April) including New York, Philly, Richmond, Dallas and Kansas City. The Institute for Supply Management (ISM) PMI (red) is through March (right axis).
It seems likely the ISM index will be weak again, and could even show contraction for April. The ISM Manufacturing Index for April will be released on Friday, May 1st, and the consensus is for an increase to 52.0 from 51.5 in March.
Case-Shiller: National House Price Index increased 4.2% year-over-year in February
by Calculated Risk on 4/28/2015 09:17:00 AM
S&P/Case-Shiller released the monthly Home Price Indices for February ("February" is a 3 month average of December, January and February prices).
This release includes prices for 20 individual cities, two composite indices (for 10 cities and 20 cities) and the monthly National index.
Note: Case-Shiller reports Not Seasonally Adjusted (NSA), I use the SA data for the graphs.
From S&P: Widespread Gains in Home Prices for February According to the S&P/Case-Shiller Home Price Indices
Data released for February 2015 show that home prices continued their rise across the country over the last 12 months. ... Both the 10-City and 20-City Composites saw larger year-over-year increases in February compared to January. The 10-City Composite gained 4.8% year-over-year, up from 4.3% in January. The 20-City Composite gained 5.0% year-over-year, compared to a 4.5% increase in January. The S&P/Case-Shiller U.S. National Home Price Index, which covers all nine U.S. census divisions, recorded a 4.2% annual gain in February 2015, weaker than the 4.4% increase in January 2015.
...
The National Index rebounded in February, reporting a 0.1% change for the month. Both the 10- and 20-City Composites reported significant month-over-month increases of 0.5%, their largest increase since July 2014. Of the sixteen cities that reported increases, San Francisco and Denver led all cities in February with increases of 2.0%and 1.4%. Cleveland reported the largest drop as prices fell 1.0%. Las Vegas and Boston reported declines of -0.3% and -0.2% respectively.
...
“Home prices continue to rise and outpace both inflation and wage gains,” said David M. Blitzer, Managing Director and Chairman of the Index Committee at S&P Dow Jones Indices. “The S&P/Case-Shiller National Index has seen 34 consecutive months with positive year-over-year gains; all 20 cities have shown year-over-year gains every month since the end of 2012. While prices are certainly rebounding, only two cities – Denver and Dallas – have surpassed their housing boom peaks. Nationally, prices are almost 10% below the high set in July 2006. Las Vegas fell 61.7% peak to trough and has the farthest to go to set a new high; it is 41.5% below its high. If a complete recovery means new highs all around, we’re not there yet.
“A better sense of where home prices are can be seen by starting in January 2000, before the housing boom accelerated, and looking at real or inflation adjusted numbers. Based on the S&P/Case-Shiller National Home Price Index, prices rose 66.8% before adjusting for inflation from January 2000 to February 2015; adjusted for inflation, this is 27.9% or a 1.7% annual rate. The highest price gain over the last 15 years was in Los Angeles with a 4.3% real annual rate; the lowest was Detroit with a -3.6% real annual rate. While nationally, prices are recovering, new construction of single family homes remains very weak despite low vacancy rates among both renters and owner-occupied homes.”
emphasis added
 Click on graph for larger image.
 The first graph shows the nominal seasonally adjusted Composite 10, Composite 20 and National indices (the Composite 20 was started in January 2000).
The Composite 10 index is off 15.2% from the peak, and up 0.9% in February (SA).
The Composite 20 index is off 14.1% from the peak, and up 0.9% (SA) in February.
The National index is off 7.6% from the peak, and up 0.4% (SA) in February. The National index is up 24.3% from the post-bubble low set in December 2011 (SA).
 The second graph shows the Year over year change in all three indices.
The Composite 10 SA is up 4.8% compared to February 2014.
The Composite 20 SA is up 5.0% year-over-year..
The National index SA is up 4.2% year-over-year.
Prices increased (SA) in all 20 of the 20 Case-Shiller cities in February seasonally adjusted. (Prices increased in 16 of the 20 cities NSA) Prices in Las Vegas are off 41.1% from the peak, and prices in Denver and Dallas are at new highs (SA).
 The last graph shows the bubble peak, the post bubble minimum, and current nominal prices relative to January 2000 prices for all the Case-Shiller cities in nominal terms.
As an example, at the peak, prices in Phoenix were 127% above the January 2000 level. Then prices in Phoenix fell slightly below the January 2000 level, and are now up 50% above January 2000 (44% nominal gain in 14 years).
These are nominal prices, and real prices (adjusted for inflation) are up about 38% since January 2000 - so the increase in Phoenix from January 2000 until now is about 10% above the change in overall prices due to inflation.
Two cities - Denver (up 64% since Jan 2000) and Dallas (up 47% since Jan 2000) - are above the bubble highs (a few other Case-Shiller Comp 20 city are close - Boston and, Charlotte). Detroit prices are still below the January 2000 level.
This was below the consensus forecast for a 4.6% YoY increase for the National index. I'll have more on house prices later.
Monday, April 27, 2015
Tuesday: Case-Shiller House Prices
by Calculated Risk on 4/27/2015 09:34:00 PM
Tuesday:
• At 9:00 AM ET, S&P/Case-Shiller House Price Index for February. Although this is the February report, it is really a 3 month average of December, January and February prices. The consensus is for a 4.6% year-over-year increase in the National Index for February. The Zillow forecast is for the National Index to increase 4.5% year-over-year in February, and for prices to increase 0.5% month-to-month seasonally adjusted.
• At 10:00 AM, the Richmond Fed Survey of Manufacturing Activity for April.
• Also at 10:00 AM, Conference Board's consumer confidence index for April. The consensus is for the index to increase to 102.5 from 101.3.
• Also at 10:00 AM, the Q1 Housing Vacancies and Homeownership report from the Census Bureau. This report is frequently mentioned by analysts and the media to report on the homeownership rate, and the homeowner and rental vacancy rates. However, this report doesn't track with other measures (like the decennial Census and the ACS).
Freddie Mac: Mortgage Serious Delinquency rate declined in March
by Calculated Risk on 4/27/2015 06:21:00 PM
Freddie Mac reported that the Single-Family serious delinquency rate declined in March to 1.73%, down from 1.81% in February. Freddie's rate is down from 2.20% in March 2014, and the rate in March was the lowest level since December 2008.
Freddie's serious delinquency rate peaked in February 2010 at 4.20%.
These are mortgage loans that are "three monthly payments or more past due or in foreclosure".
Note: Fannie Mae will report their Single-Family Serious Delinquency rate for March in a few days.

Although the rate is declining, the "normal" serious delinquency rate is under 1%.
The serious delinquency rate has fallen 0.47 percentage points over the last year - and the rate of improvement has slowed recently - but at that rate of improvement, the serious delinquency rate will not be below 1% until late 2016.
So even though distressed sales are declining, I expect an above normal level of Fannie and Freddie distressed sales through 2016 (mostly in judicial foreclosure states).


