 RSS Feed
 by Calculated Risk on 4/25/2015 01:15:00 PM
Saturday, April 25, 2015
Schedule for Week of April 26, 2015
The key report this is week is Q1 GDP on Wednesday. Also the FOMC will meet on Tuesday and Wednesday, and release a statement on Wednesday.
Other key reports include the March Personal Income and Outlays report on Thursday, April ISM manufacturing index on Friday, April vehicle sales on Friday, and the Case-Shiller house prices on Tuesday.
10:30 AM: Dallas Fed Manufacturing Survey for April.
 9:00 AM: S&P/Case-Shiller House Price Index for February. Although this is the February report, it is really a 3 month average of December, January and February prices.
This graph shows the nominal seasonally adjusted National Index, Composite 10 and Composite 20 indexes through the January 2015 report (the Composite 20 was started in January 2000).
The consensus is for a 4.6% year-over-year increase in the National Index for February. The Zillow forecast is for the National Index to increase 4.5% year-over-year in February, and for prices to increase 0.5% month-to-month seasonally adjusted.
10:00 AM: Richmond Fed Survey of Manufacturing Activity for April.
10:00 AM: Conference Board's consumer confidence index for April. The consensus is for the index to increase to 102.5 from 101.3.
10:00 AM: Q1 Housing Vacancies and Homeownership report from the Census Bureau. This report is frequently mentioned by analysts and the media to report on the homeownership rate, and the homeowner and rental vacancy rates. However, this report doesn't track with other measures (like the decennial Census and the ACS).
7:00 AM: The Mortgage Bankers Association (MBA) will release the results for the mortgage purchase applications index.
8:30 AM: Gross Domestic Product, 1st quarter 2015 (advance estimate). The consensus is that real GDP increased 1.0% annualized in Q1.
10:00 AM: Pending Home Sales Index for March. The consensus is for a 1.0% increase in the index.
2:00 PM: FOMC Meeting Statement.
8:30 AM: The initial weekly unemployment claims report will be released. The consensus is for claims to decrease to 290 thousand from 295 thousand.
8:30 AM ET: Personal Income and Outlays for March. The consensus is for a 0.2% increase in personal income, and for a 0.5% increase in personal spending. And for the Core PCE price index to increase 0.2%.
9:45 AM: Chicago Purchasing Managers Index for April. The consensus is for a reading of 50.0, up from 46.3 in March.
 10:00 AM: ISM Manufacturing Index for April. The consensus is for an increase to 52.0 from 51.5 in March.
Here is a long term graph of the ISM manufacturing index.
The ISM manufacturing index indicated expansion at 51.5% in March. The employment index was at 50.0%, and the new orders index was at 51.8%.
10:00 AM: Construction Spending for March. The consensus is for a 0.5% increase in construction spending.
 All day: Light vehicle sales for April. The consensus is for light vehicle sales to decrease to 16.9 million SAAR in April from 17.05 million in March (Seasonally Adjusted Annual Rate).
This graph shows light vehicle sales since the BEA started keeping data in 1967. The dashed line is the March sales rate.
10:00 AM: University of Michigan's Consumer sentiment index (final for April). The consensus is for a reading of 96.0, up from the preliminary reading of 95.9, and up from the March reading of 93.0.
April 2015: Unofficial Problem Bank list declines to 342 Institutions
by Calculated Risk on 4/25/2015 08:15:00 AM
This is an unofficial list of Problem Banks compiled only from public sources.
Here is the unofficial problem bank list for April 2015.
Changes and comments from surferdude808:
Update on the Unofficial Problem Bank List for April 2015. During the month, the list fell from 349 institutions to 342 after nine removals and two additions. Assets dropped by $1.2 billion to an aggregate $105.1 billion. A year ago, the list held 513 institutions with assets of $167.3 billion.
Actions were terminated against Orrstown Bank, Shippensburg, PA ($1.2 billion Ticker: ORRF); Atlantic Coast Bank, Jacksonville, FL ($709 million Ticker: ACFC); The Leaders Bank, Oak Brook, IL ($353 million); PrimeSouth Bank, Blackshear, GA ($326 million); The Exchange Bank, Skiatook, OK ($87 million); and Community Savings, Caldwell, OH ($68 billion). Finding their way off the list through merger were Colonial Bank, FSB, Vineland, NJ ($542 million Ticker: COBK); Baytree National Bank & Trust Company, Lake Forest, IL ($77 million); and Bank Reale, Pasco, WA ($38 million Ticker: BKRL).
The two additions this month were Lone Star National Bank, Pharr, TX ($2.2 billion) and Covenant Bank, Leeds, AL ($76 million).
Friday, April 24, 2015
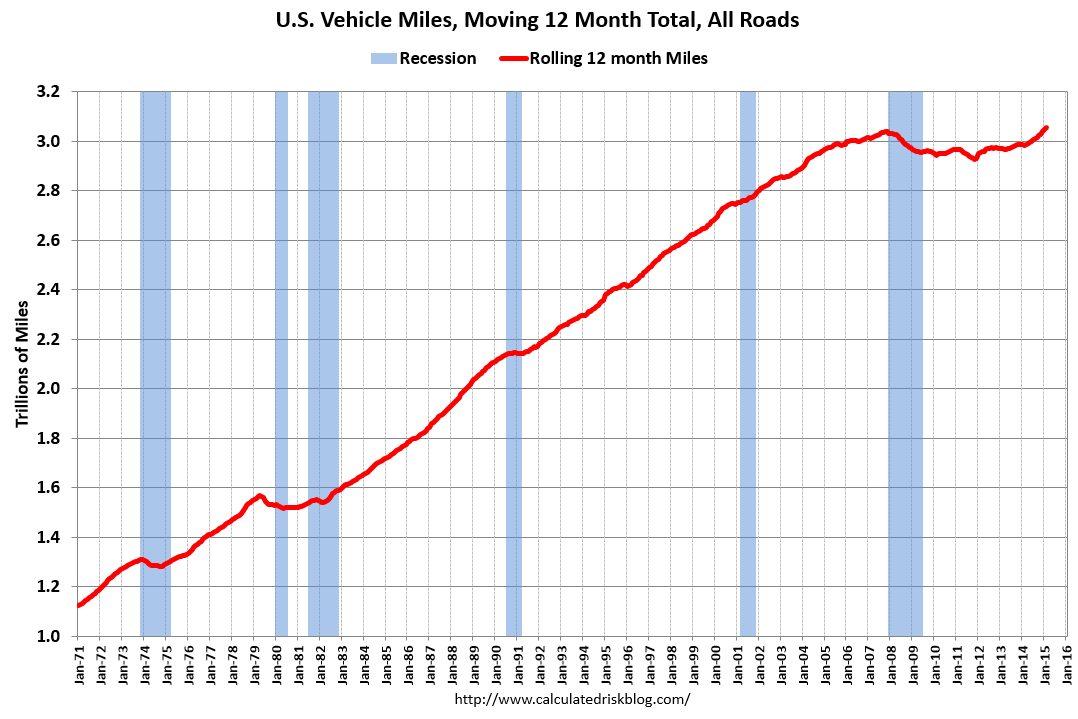
DOT: Vehicle Miles Driven increased 2.8% year-over-year in February, Rolling 12 Months at All Time High
by Calculated Risk on 4/24/2015 06:34:00 PM
Note: With lower gasoline prices, vehicle miles driven have reached a new high on a rolling 12 month basis.
The Department of Transportation (DOT) reported:
Travel on all roads and streets changed by 2.8% (6.1 billion vehicle miles) for February 2015 as compared with February 2014.The following graph shows the rolling 12 month total vehicle miles driven to remove the seasonal factors.
Travel for the month is estimated to be 221.1 billion vehicle miles
The seasonally adjusted vehicle miles traveled for February 2015 is 254.1 billion miles, a 2.6% (6.4 billion vehicle miles) increase over February 2014. It also represents a -1.2% change (-3.2 billion vehicle miles) compared with January 2015.
The rolling 12 month total is moving up, after moving sideways for several years.
 Click on graph for larger image.
In the early '80s, miles driven (rolling 12 months) stayed below the previous peak for 39 months.
Miles driven (rolling 12) had been below the previous peak for 85 months - an all time record - before reaching a new high for miles driven in January (and again in February).
The second graph shows the year-over-year change from the same month in the previous year.
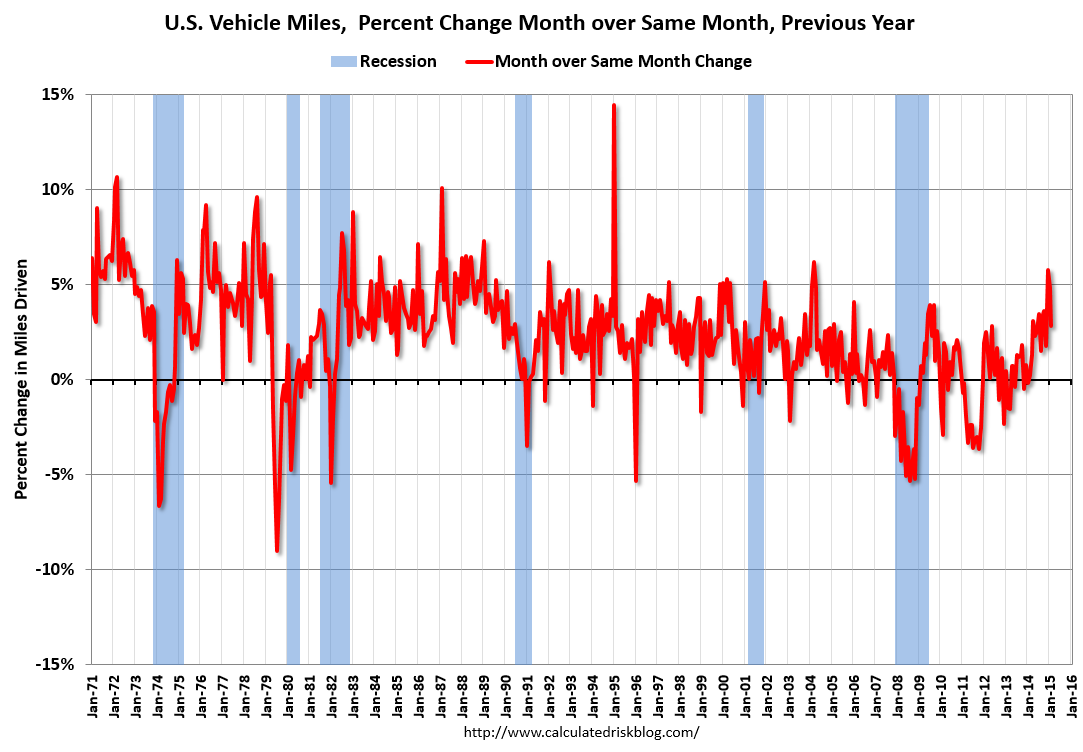 In February 2015, gasoline averaged of $2.30 per gallon according to the EIA. That was down significantly from January 2014 when prices averaged $3.43 per gallon.
 However gasoline prices are just part of the story. The lack of growth in miles driven over the last 7 years was probably also due to the lingering effects of the great recession (lack of wage growth), the aging of the overall population (over 55 drivers drive fewer miles) and changing driving habits of young drivers.
Now, miles driven - on a rolling 12 month basis - is at a new high.
Nomura Forecast: Q1 GDP at 1.0%
by Calculated Risk on 4/24/2015 01:37:00 PM
From economists at Nomura: US Q1 GDP: It will likely show that final sales barely grew, but April data should be better.
Adverse weather conditions, West Coast port disruptions, the stronger dollar and the decline in crude oil prices all likely hurt economic activity in Q1 2015. Business investment slowed considerably as oil and gas exploration projects halted abruptly and precipitously on lower crude oil prices while manufacturing activity was additionally hurt by the stronger dollar. Also, we believe that lower gasoline prices failed to spur consumer activity as it appears that households decided to save or pay down debt using the extra money saved from lower gasoline prices. Furthermore, adverse weather conditions likely hurt consumer and construction activity. Taken together, we expect headline Q1 GDP to grow by 1.0% q-o-q on an annualized rate with final sales increasing by only 0.1%.
However, there are two key sources of uncertainty worth noting. First, the Bureau of Economic Analysis (BEA) will only have the first two months of trade data on hand and will have to make some assumptions for March. This is in no way different from other years. However, due to West Coast port labor disputes, trade activity slowed considerably in the first two months of the year. BEA’s assumptions on how quickly trade activity rebounded will have a notable impact on topline GDP. Second, our work suggests that there is material residual seasonality in topline GDP in Q1 as it tends to be below trend due to strong seasonal patterns in defense spending. As such, we now expect government expenditures to be more of a drag than we had previously assumed. Nevertheless, this factor remains a key source of uncertainty.
Philly Fed: State Coincident Indexes increased in 41 states in March
by Calculated Risk on 4/24/2015 11:59:00 AM
From the Philly Fed:
The Federal Reserve Bank of Philadelphia has released the coincident indexes for the 50 states for March 2015. In the past month, the indexes increased in 41 states, decreased in four, and remained stable in five, for a one-month diffusion index of 74. Over the past three months, the indexes increased in 46 states, decreased in three, and remained stable in one, for a three-month diffusion index of 86.Note: These are coincident indexes constructed from state employment data. An explanation from the Philly Fed:
The coincident indexes combine four state-level indicators to summarize current economic conditions in a single statistic. The four state-level variables in each coincident index are nonfarm payroll employment, average hours worked in manufacturing, the unemployment rate, and wage and salary disbursements deflated by the consumer price index (U.S. city average). The trend for each state’s index is set to the trend of its gross domestic product (GDP), so long-term growth in the state’s index matches long-term growth in its GDP.
 Click on graph for larger image.
This is a graph is of the number of states with one month increasing activity according to the Philly Fed. This graph includes states with minor increases (the Philly Fed lists as unchanged).
In March, 44 states had increasing activity (including minor increases).
It appears we are seeing weakness in several oil producing states including Alaska and Oklahoma. It wouldn't be surprising if North Dakota, Texas and other oil producing states also turned red later this year.
 Here is a map of the three month change in the Philly Fed state coincident indicators. This map was all red during the worst of the recession, and is almost all green again.
 Note: Blue added for Red/Green issues.


