by Calculated Risk on 4/22/2015 08:59:00 AM
Wednesday, April 22, 2015
AIA: Architecture Billings Index increases in March, Multi-Family Negative
Note: This index is a leading indicator primarily for new Commercial Real Estate (CRE) investment.
From the AIA: Architecture Billings Index Accelerates in March
For the second consecutive month, the Architecture Billings Index (ABI) indicated a modest increase in design activity in March. As a leading economic indicator of construction activity, the ABI reflects the approximate nine to twelve month lead time between architecture billings and construction spending. The American Institute of Architects (AIA) reported the March ABI score was 51.7, up from a mark of 50.4 in February. This score reflects an increase in design services (any score above 50 indicates an increase in billings). The new projects inquiry index was 58.2, up from a reading of 56.6 the previous month.
“Business conditions at architecture firms generally are quite healthy across the country. However, billings at firms in the Northeast were set back with the severe weather conditions, and this weakness is apparent in the March figures,” said AIA Chief Economist Kermit Baker, Hon. AIA, PhD. “The multi-family residential market has seen its first occurrence of back-to-back negative months for the first time since 2011, while the institutional and commercial sectors are both on solid footing.”
emphasis added
 Click on graph for larger image.
This graph shows the Architecture Billings Index since 1996. The index was at 51.7 in March, up from 50.4 in February. Anything above 50 indicates expansion in demand for architects' services.
Note: This includes commercial and industrial facilities like hotels and office buildings, multi-family residential, as well as schools, hospitals and other institutions. The multi-family residential market was negative in consecutive months for the first time since 2011 - and this might be indicating a slowdown for apartments. (just two months)
According to the AIA, there is an "approximate nine to twelve month lag time between architecture billings and construction spending" on non-residential construction. This index was mostly positive over the last year, suggesting an increase in CRE investment in 2015.
MBA: Mortgage Applications Increase, Purchase Apps up 16% YoY
by Calculated Risk on 4/22/2015 07:01:00 AM
From the MBA: Mortgage Applications Increase in Latest MBA Weekly Survey
Mortgage applications increased 2.3 percent from one week earlier, according to data from the Mortgage Bankers Association’s (MBA) Weekly Mortgage Applications Survey for the week ending April 17, 2015. ...
The Refinance Index increased 1 percent from the previous week. The seasonally adjusted Purchase Index increased 5 percent from one week earlier to its highest level since June 2013. The unadjusted Purchase Index increased 6 percent compared with the previous week and was 16 percent higher than the same week one year ago.
...
“Purchase applications increased for the fourth time in five weeks as we proceed further into the spring home buying season. Despite mortgage rates below four percent, refinance activity increased less than one percent from the previous week,” said Mike Fratantoni, MBA’s Chief Economist.
The average contract interest rate for 30-year fixed-rate mortgages with conforming loan balances ($417,000 or less) decreased to 3.83 percent, its lowest level since January 2015, from 3.87 percent, with points decreasing to 0.32 from 0.38 (including the origination fee) for 80 percent loan-to-value ratio (LTV) loans.
emphasis added
 Click on graph for larger image.
The first graph shows the refinance index.
2014 was the lowest year for refinance activity since year 2000.
2015 will probably see a little more refinance activity than in 2014, but not a large refinance boom.
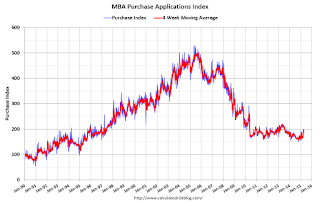
 The second graph shows the MBA mortgage purchase index.
 According to the MBA, the index is at the highest level since June 2013, and the unadjusted purchase index is 16% higher than a year ago.
Tuesday, April 21, 2015
Wednesday: Existing Home Sales
by Calculated Risk on 4/21/2015 07:59:00 PM
Here is a hint, take the over on existing home sales!
Wednesday:
• At 7:00 AM ET, the Mortgage Bankers Association (MBA) will release the results for the mortgage purchase applications index.
• At 9:00 AM, FHFA House Price Index for February 2015. This was originally a GSE only repeat sales, however there is also an expanded index.
• At 10:00 AM, Existing Home Sales for March from the National Association of Realtors (NAR). The consensus is for sales of 5.03 million on seasonally adjusted annual rate (SAAR) basis. Sales in February were at a 4.88 million SAAR. Economist Tom Lawler estimates the NAR will report sales of 5.18 million SAAR.
• During the day: The AIA's Architecture Billings Index for March (a leading indicator for commercial real estate).
Chemical Activity Barometer "Leading Economic Indicator Rises for Fourth Consecutive Month"
by Calculated Risk on 4/21/2015 04:09:00 PM
Here is a relatively new indicator that I'm following that appears to be a leading indicator for industrial production.
From the American Chemistry Council: Leading Economic Indicator Rises for Fourth Consecutive Month; Reaches Seven Year High
TThe Chemical Activity Barometer (CAB), a leading economic indicator created by the American Chemistry Council (ACC), was up 0.1 percent in April, as measured on a three-month moving average (3MMA). Reaching an index of 98.1, last seen in January 2008, the CAB remains up 2.6 percent over a year ago, and suggests gains in business activity will continue into the fourth quarter. ...
“All of the major production-related indicators are up and we might continue to see a strengthening. Construction-related chemistries have been adversely affected by bad weather so far this year, but we expect an improvement as we get further into spring,” said Kevin Swift, chief economist at the American Chemistry Council. “The data on plastic resins and polymers for packaging suggest that retail sales should continue to be strong as well,” Swift added.
emphasis added
 Click on graph for larger image.
This graph shows the year-over-year change in the 3-month moving average for the Chemical Activity Barometer compared to Industrial Production. It does appear that CAB (red) generally leads Industrial Production (blue).
And this suggests continued growth.
Lawler: NVR: Home Orders Jump, Prices “Stable” in Latest Quarter
by Calculated Risk on 4/21/2015 12:59:00 PM
From housing economist Tom Lawler:
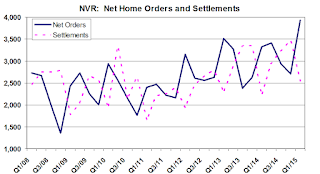
NVR, Inc., the nation’s fourth largest home builder with a relatively heavy concentration in the Mid-Atlantic region, reported that net home orders in the quarter ended March 31, 2015 totaled 3,926, up 18.1% from the comparable quarter of 2014. The average net order price last quarter was $375,400, up 2.0% from a year ago. Net orders per active community were up 19.8% YOY. Home deliveries last quarter totaled 2,534, up 14.6% from the comparable quarter of 2014, at an average sales price of $371,000, up 2.7% from a year ago. The company’s order backlog at the end of March was 6,867, up 13.5% from last March, at an average order price of $384,300, up 2.6% from a year ago. The company’s gross homebuilding margin last quarter was 17%, compared to 18% in the comparable quarter of 2014.
NVR gives virtually no “color” on its results or on the housing market in its press release, and does not host a quarterly earnings conference call.
D.R. Horton, the nation’s largest home builder, releases its results for the quarter ended March 31st tomorrow morning before the market opens.


