 RSS Feed
 by Calculated Risk on 4/02/2015 08:54:00 AM
Thursday, April 02, 2015
Trade Deficit decreased in February to $35.4 Billion
The Department of Commerce reported:
The U.S. Census Bureau and the U.S. Bureau of Economic Analysis, through the Department of Commerce, announced today that the goods and services deficit was $35.4 billion in February, down $7.2 billion from $42.7 billion in January, revised. February exports were $186.2 billion, $3.0 billion less than January exports. February imports were $221.7 billion, $10.2 billion less than January imports.The trade deficit smaller than the consensus forecast of $41.5 billion.
The first graph shows the monthly U.S. exports and imports in dollars through February 2015.
 Click on graph for larger image.
Imports and exports decreased in February (probably due to impact of West Coast port slowdown).
Exports are 12% above the pre-recession peak and down 1% compared to February 2014; imports are 4% below the pre-recession peak, and down 4% compared to February 2014.
The second graph shows the U.S. trade deficit, with and without petroleum.
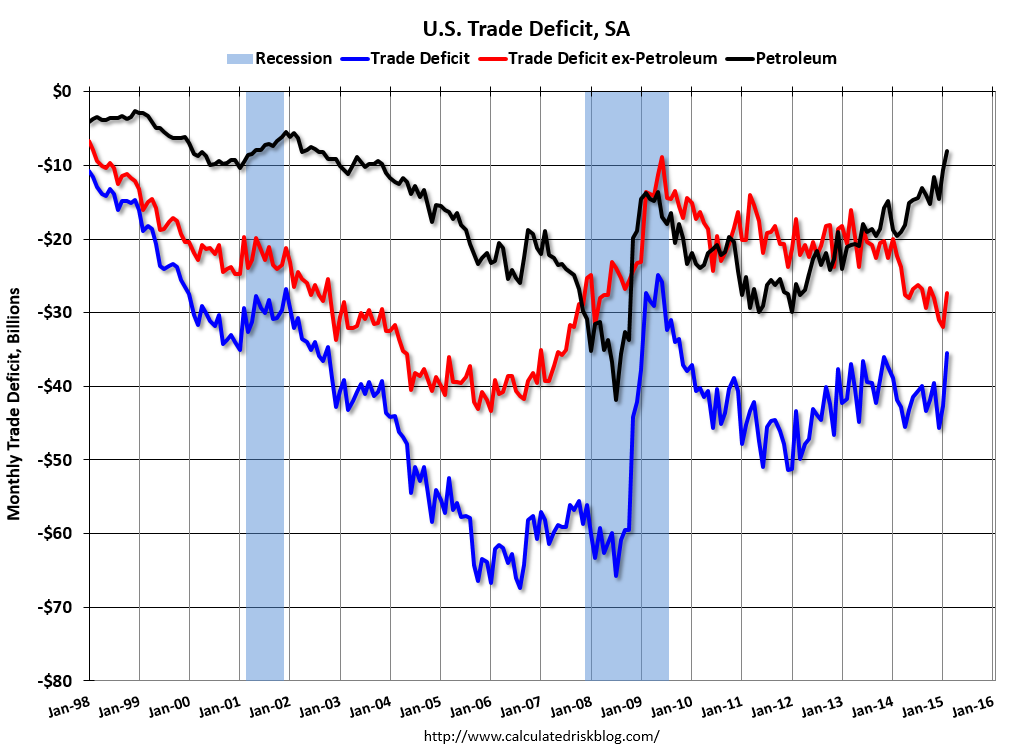 The blue line is the total deficit, and the black line is the petroleum deficit, and the red line is the trade deficit ex-petroleum products.
Oil imports averaged $49.53 in February, down from $58.96 in January, and down from $91.53 in February 2014. The petroleum deficit has generally been declining and is the major reason the overall deficit has declined since early 2012.
Oil prices will probably increase a little in the March report. Note: There is a lag due to shipping and long term contracts.
The trade deficit with China increased to $22.5 billion in February, from $20.8 billion in February 2014. The deficit with China is a large portion of the overall deficit.
The decrease in the trade deficit was due to a lower volume and lower price of oil imports, and the West Coast port slowdown. Oil prices will probably be a little higher in March, and trade will be up sharply at the West Coast ports.
Weekly Initial Unemployment Claims decreased to 268,000
by Calculated Risk on 4/02/2015 08:30:00 AM
The DOL reported:
In the week ending March 28, the advance figure for seasonally adjusted initial claims was 268,000, a decrease of 20,000 from the previous week's revised level. The previous week's level was revised up by 6,000 from 282,000 to 288,000. The 4-week moving average was 285,500, a decrease of 14,750 from the previous week's revised average. The previous week's average was revised up by 3,250 from 297,000 to 300,250.The previous week was revised up to 288,000.
There were no special factors impacting this week's initial claims.
The following graph shows the 4-week moving average of weekly claims since January 2000.
 Click on graph for larger image.
The dashed line on the graph is the current 4-week average. The four-week average of weekly unemployment claims decreased to 285,500.
This was below the consensus forecast of 285,000, and the low level of the 4-week average suggests few layoffs.
Wednesday, April 01, 2015
Thursday: Trade Deficit, Unemployment Claims
by Calculated Risk on 4/01/2015 08:09:00 PM
Update to "It never rains in California" ... from the Sacramento Bee: Jerry Brown orders mandatory water reductions amid California drought
With California slogging into its fourth year of withering drought, Gov. Jerry Brown on Wednesday ordered mandatory water reductions of 25 percent in cities and towns across the state.Thursday:
...
The snowpack, which typically accounts for about 30 percent of California’s water supply, has been declining since the first manual survey of the season, in December. According to the most recent electronic readings, it now stands at its lowest level in recorded history, just 8 percent of average.
• 8:30 AM ET, the initial weekly unemployment claims report will be released. The consensus is for claims to increase to 285 thousand from 282 thousand.
• At 8:30 AM, the Trade Balance report for February from the Census Bureau. The consensus is for the U.S. trade deficit to be at $41.5 billion in February from $41.8 billion in January.
• Early: Reis Q1 2015 Apartment Survey of rents and vacancy rates.
• At 10:00 AM, Manufacturers' Shipments, Inventories and Orders (Factory Orders) for February. The consensus is for no change in February orders.
U.S. Light Vehicle Sales increase to 17.05 million annual rate in March
by Calculated Risk on 4/01/2015 02:57:00 PM
Based on a WardsAuto estimate, light vehicle sales were at a 17.05 million SAAR in March. That is up 3.8% from March 2014, and up 5.5% from the 16.2 million annual sales rate last month.
From John Sousanis at Wards Auto: March 2015 U.S. LV Sales Thread: Spring Sales Lift SAAR Past 17 Million
U.S. automakers sold 1, 537,820 light vehicles in March, as several automakers posted record sales and European luxury brands largely outperformed expectations.
The results reflected a 4.4% gain in the daily sales rate compared with same-month year-ago, and pushed the industry's light-vehicle SAAR past the 17-million mark for the first time since November.
 Click on graph for larger image.
This graph shows the historical light vehicle sales from the BEA (blue) and an estimate for March (red, light vehicle sales of 17.05 million SAAR from WardsAuto).
This was above the consensus forecast of 16.8 million SAAR (seasonally adjusted annual rate).
The second graph shows light vehicle sales since the BEA started keeping data in 1967.
 Note: dashed line is current estimated sales rate.
This was the first time above 17 million SAAR since last November. A solid month.
Construction Spending decreased 0.1% in February
by Calculated Risk on 4/01/2015 12:35:00 PM
Earlier today, the Census Bureau reported that overall construction spending decreased in February:
The U.S. Census Bureau of the Department of Commerce announced today that construction spending during February 2015 was estimated at a seasonally adjusted annual rate of $967.2 billion, 0.1 percent below the revised January estimate of $967.9 billion. The February figure is 2.1 percent above the February 2014 estimate of $947.1 billion.Private spending increased and public spending decreased:
Spending on private construction was at a seasonally adjusted annual rate of $698.2 billion, 0.2 percent above the revised January estimate of $696.9 billion. ...Note: Non-residential for offices and hotels is generally increasing, but spending for oil and gas is generally declining. Early in the recovery, there was a surge in non-residential spending for oil and gas (because prices increased), but now, with falling prices, oil and gas is a drag on overall construction spending.
In February, the estimated seasonally adjusted annual rate of public construction spending was $268.9 billion, 0.8 percent below the revised January estimate of $271.0 billion.
emphasis added
As an example, construction spending for lodging is up 10% year-over-year, whereas spending for power (includes oil and gas) construction peaked in mid-2014 and is down 17% year-over-year.
 Click on graph for larger image.
This graph shows private residential and nonresidential construction spending, and public spending, since 1993. Note: nominal dollars, not inflation adjusted.
Private residential spending dipped a little last year, but is increasing again.
Non-residential spending is 16% below the peak in January 2008.
Public construction spending is now 17% below the peak in March 2009 and about 3% above the post-recession low.
 The second graph shows the year-over-year change in construction spending.
On a year-over-year basis, private residential construction spending is down 2%. Non-residential spending is up 6% year-over-year. Public spending is up 3% year-over-year.
Looking forward, all categories of construction spending should increase in 2015. Residential spending is still very low, non-residential is starting to pickup (except oil and gas), and public spending has probably hit bottom after several years of austerity.
This was below the consensus forecast of a 0.2% increase, and spending for January was revised down (December was revised up).


