by Calculated Risk on 2/25/2015 10:00:00 AM
Wednesday, February 25, 2015
New Home Sales at 481,000 Annual Rate in January, Highest January since 2008
The Census Bureau reports New Home Sales in January were at a seasonally adjusted annual rate (SAAR) of 481 thousand.
November sales were revised up from 431 thousand to 446 thousand, and December sales were revised up from 481 thousand to 482 thousand.
"Sales of new single-family houses in January 2015 were at a seasonally adjusted annual rate of 481,000, according to estimates released jointly today by the U.S. Census Bureau and the Department of Housing and Urban Development. This is 0.2 percent below the revised December rate of 482,000, but is 5.3 percent above the January 2014 estimate of 457,000."
 Click on graph for larger image.
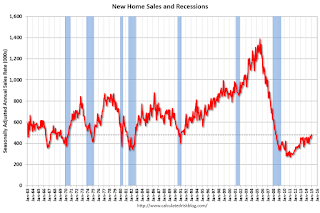
The first graph shows New Home Sales vs. recessions since 1963. The dashed line is the current sales rate.
Even with the increase in sales over the previous two years, new home sales are barely above the bottom for previous recessions.
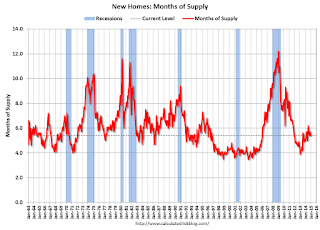
The second graph shows New Home Months of Supply.
 The months of supply was unchanged in January at 5.4 months.
 The all time record was 12.1 months of supply in January 2009.
This is now in the normal range (less than 6 months supply is normal).
"The seasonally adjusted estimate of new houses for sale at the end of January was 218,000. This represents a supply of 5.4 months at the current sales rate."
 On inventory, according to the Census Bureau:
 "A house is considered for sale when a permit to build has been issued in permit-issuing places or work has begun on the footings or foundation in nonpermit areas and a sales contract has not been signed nor a deposit accepted."Starting in 1973 the Census Bureau broke this down into three categories: Not Started, Under Construction, and Completed.
The third graph shows the three categories of inventory starting in 1973.
The inventory of completed homes for sale is still low, and the combined total of completed and under construction is also low.
 The last graph shows sales NSA (monthly sales, not seasonally adjusted annual rate).
In January 2015 (red column), 36 thousand new homes were sold (NSA). Last year 33 thousand homes were sold in January. This is the highest for January since 2008.
The high for January was 92 thousand in 2005, and the low for January was 21 thousand in 2011.
This was above expectations of 471,000 sales in January, and is a decent start to 2015. I'll have more later today.
MBA: Purchase Mortgage Applications Increase, Refinance Applications Decrease in Latest MBA Weekly Survey
by Calculated Risk on 2/25/2015 07:00:00 AM
From the MBA: Mortgage Applications Decrease in Latest MBA Weekly Survey
Mortgage applications decreased 3.5 percent from one week earlier, according to data from the Mortgage Bankers Association’s (MBA) Weekly Mortgage Applications Survey for the week ending February 20, 2015. This week’s results include an adjustment to account for the Presidents’ Day holiday. ...
The Refinance Index decreased 8 percent from the previous week. The seasonally adjusted Purchase Index increased 5 percent from one week earlier.
...
The average contract interest rate for 30-year fixed-rate mortgages with conforming loan balances ($417,000 or less) increased to 3.99 percent from 3.93 percent, with points decreasing to 0.33 from 0.35 (including the origination fee) for 80 percent loan-to-value ratio (LTV) loans.
emphasis added
 Click on graph for larger image.
The first graph shows the refinance index.
2014 was the lowest year for refinance activity since year 2000.
2015 will probably see more refinance activity than in 2014, but not a large refinance boom.
 The second graph shows the MBA mortgage purchase index.
 According to the MBA, the unadjusted purchase index is down 2% from a year ago.
Tuesday, February 24, 2015
Wednesday: New Home Sales, Yellen
by Calculated Risk on 2/24/2015 08:26:00 PM
The following paragraph from Fed Chair Janet Yellen's testimony today seems to suggest "patient" will be dropped from the FOMC statement at the March 17-18 meeting. Sentence by sentence:
The FOMC's assessment that it can be patient in beginning to normalize policy means that the Committee considers it unlikely that economic conditions will warrant an increase in the target range for the federal funds rate for at least the next couple of FOMC meetings.That just repeated the current understanding. If the FOMC wants to have the option to raise rates in June, they would most likely drop "patient" from the statement in March (June is the second meeting after March).
If economic conditions continue to improve, as the Committee anticipates, the Committee will at some point begin considering an increase in the target range for the federal funds rate on a meeting-by-meeting basis. Before then, the Committee will change its forward guidance.Yes, the FOMC needs to drop "patient" before they move to a meeting-by-meeting basis.
However, it is important to emphasize that a modification of the forward guidance should not be read as indicating that the Committee will necessarily increase the target range in a couple of meetings.This was the clarification today. Although "patient" probably means no hike for at least two meetings, dropping "patient" does not mean a rate hike is guaranteed two meetings later - just that a hike may be considered based on incoming data (employment and inflation).
Right now I expect the FOMC to drop patient at the next meeting.
Wednesday:
• At 7:00 AM ET, Mortgage Bankers Association (MBA) will release the results for the mortgage purchase applications index.
• At 10:00 AM, New Home Sales for January from the Census Bureau. The consensus is for a decrease in sales to 471 thousand Seasonally Adjusted Annual Rate (SAAR) in January from 481 thousand in December.
• Also at 10:00 AM, Testimony, Fed Chair Janet Yellen, Semiannual Monetary Policy Report to the Congress, Before the House Financial Services Committee, Washington, D.C. (Report will be a repeat, plus Q&A).
Lawler on Toll Brothers and Other Builders: Maybe Points to Strong New Home Sales in January
by Calculated Risk on 2/24/2015 04:27:00 PM
From housing economist Tom Lawler: Toll Brothers: Net Orders Up 16% YOY in Latest Quarter; “Traditional” Net Orders Up 20.7%; Ex the West, Net Orders Down
Toll Brothers, the self-described “nation’s leading builder of luxury homes,” reported that net home orders in the quarter ended January 31, 2015 totaled 1,063, up 16.0% from the disappointed orders in the comparable quarter of 2014. Net orders per community were up 3.5% from a year earlier. Net orders in the company’s “traditional” home building operations totaled 1,044, up 20.7% from the comparable quarter of 2014. Home deliveries last quarter totaled 1,091, up 17.6% from the comparable quarter of 2014, at an average sales price of $782,300, up 12.8% from a year earlier. “Traditional” home delivers totaled 1,091, up 17.5% from the comparable quarter of 2014, at an average sales price of $714,900, up 2.8% from a year earlier. The company’s order backlog at the end of January was 3,651, down 0.4% from last January, at an average order price of $750,000, up 2.5% from a year earlier. The backlog for traditional building at the end of January was 3,536, up 2.9% from last January, at an average sales price of $732,000, up 4.5% from a year earlier.
Compared to a year ago Toll’s traditional net orders were down in every region save the West (Arizona, California, Colorado, Nevada, and Washington), as shown in the table below. Part of the YOY gain in the West reflected orders from lots and communities in California obtained from the acquisition of Shapell Industries, which closed last February. That acquisition included 5,219 lots in Northern and Southern California, 4,122 of which were not finished as of 8/31/2013. When asked whether the strong YOY growth in net orders in the West reflected orders associated with the Shappell acquisition or from “core” strength in the region, a company official said “it was both.” The fact that Toll’s net order (and settlement) price in the West was down from a year ago, however, suggested that a “good chunk” of the YOY order gain in the West was related to the Shapell acquisition (Shapell’s average sales price had been lower than Toll’s) – especially given management’s discussion of “pricing power” in many California markets.
| Net Home Orders | Average Net Order Price | |||||
|---|---|---|---|---|---|---|
| Qtr. Ended: | 1/31/2015 | 1/31/2014 | % Chg. | 1/31/2015 | 1/31/2014 | % Chg. |
| North | 177 | 181 | -2.2% | $625,100 | $652,900 | -4.3% |
| Mid-Atlantic | 224 | 263 | -14.8% | $659,500 | $623,100 | 5.8% |
| South | 199 | 222 | -10.4% | $850,700 | $758,100 | 12.2% |
| West | 444 | 199 | 123.1% | $905,100 | $944,100 | -4.1% |
| Traditional | 1044 | 865 | 20.7% | $794,000 | $737,800 | 7.6% |
| City Living | 19 | 51 | -62.7% | $2,301,900 | $1,245,700 | 84.8% |
| Total | 1063 | 916 | 16.0% | $821,500 | $766,100 | 7.2% |
On the “pricing power” front, while on the December conference call officials focused on the reduction in pricing power across many of its markets, today officials seemed a touch more optimistic – although comments with vague, save that in Northern California, Southern California, the New York City area, and certain parts of Florida pricing power appeared to have improved.
Officials also said since the start of the current quarter (February 1), signed contracts were running about 13% higher than the comparable period of 2014.
And Some News from Other Builders Points to Strong New Home Sales in January (maybe)
In significantly older news but related to early 2015 home sales, KB Home reported (on February 11) that net home orders from December 1, 2014 through February 6, 2015 totaled 1,499, up 24.8% from the comparable period of a year earlier. At the beginning of its current fiscal quarter (which runs from December 1, 2014 through February 28, 2015) the company had 227 communities for sale, up 19% from a year earlier. Quarter-to-date net order value over this period was up 25.5% from the comparable year-earlier period, implying a YOY gain in net order price of about 1%.
KB Home released these preliminary quarter-to-date order numbers in conjunction with the commencement of a public offerening of $250 million in senior notes.
Meanwhile, in anticipation of management’s meetings with investors at a conference this week, Meritage Homes reported that net home orders in January totaled 606, up 48% from last January. Meritage said that net orders per community were up 24% YOY.
While it is dangerous to attempt to translate reported net orders from builders to Census’ estimates for new home sales – even when one has a lot of builder reports – my “gut” tells me that Census’ report on new home sales for January will beat “consensus.”
CR Note: New Home sales for January will be released tomorrow morning at 10:00 AM ET. The consensus is for a decrease in sales to 471 thousand Seasonally Adjusted Annual Rate (SAAR) in January from 481 thousand in December.
FDIC: Fewer Problem banks, Residential REO Declines in Q4
by Calculated Risk on 2/24/2015 03:41:00 PM
The FDIC released the Quarterly Banking Profile for Q4 today.
The banking industry continued to improve at the end of the year. Although total industry earnings declined as a result of significant litigation expenses at a few large institutions and a continued decline in mortgage-related income, a majority of banks reported higher operating revenues and improved earnings from the previous year. In addition, banks made loans at a faster pace, asset quality improved, and the number of banks on the problem list declined to the lowest level in six years.
...
[F]ourth quarter net income was 36.9 billion dollars, down 7.3 percent from the prior year. The principal reasons for the decline were a 4.4 billion dollar increase in litigation expenses concentrated at a few large institutions and a 1.6 billion dollar decline in mortgage-related noninterest income.
emphasis added
 Click on graph for larger image.
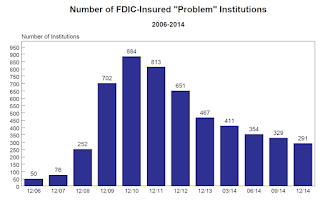
The FDIC reported the number of problem banks declined (Note: graph shows problem banks quarterly for 2014, and year end prior to 2014):
The number of banks on the problem list fell to the lowest level since the third quarter of 2008. There were 291 banks on the problem list at the end of 2014, less than one-third of the 888 problem banks at the peak in March 2011. Total assets of banks on the problem list fell to 87 billion dollars.
This is the first time problem bank assets have been below 100 billion dollars since March 2008.
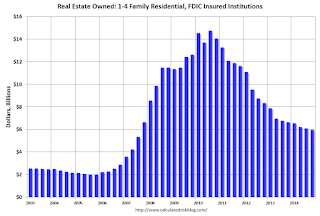
 The dollar value of 1-4 family residential Real Estate Owned (REOs, foreclosure houses) declined from $6.10 billion in Q3 2014 to $5.98 billion in Q4. This is the lowest level of REOs since Q3 2007.
This graph shows the dollar value of Residential REO for FDIC insured institutions. Note: The FDIC reports the dollar value and not the total number of REOs.


