 RSS Feed
 by Calculated Risk on 11/19/2014 06:15:00 PM
Wednesday, November 19, 2014
Lawler: Updated Read on Existing Home Sales, Table of Distressed Sales in October
From housing economist Tom Lawler:
Based on state and local realtor/MLS reports released through today, I have increased my estimate of October existing home sales as measured by the National Association of Realtors to a seasonally adjusted annual rate of 5.31 million (my estimate in last Friday’s report was 5.28 million). I also now “guesstimate” that the NAR’s existing home inventory number for October will be down 3.5% from September, and up 5.2% from last October. Finally, I project that the NAR’s median existing SF home sales price for October will be about 4% higher than last October.
CR Note: Existing home sales will be released tomorrow, and the consensus has moved up since Friday, and is now at 5.15 million.
Lawler also sent me the updated table below of short sales, foreclosures and cash buyers for selected cities in October.
On distressed: Total "distressed" share is down in these markets mostly due to a decline in short sales.
Short sales are down significantly in these areas.
Foreclosures are up in several of these areas.
The All Cash Share (last two columns) is mostly declining year-over-year. As investors pull back, the share of all cash buyers will probably continue to decline.
| Short Sales Share | Foreclosure Sales Share | Total "Distressed" Share | All Cash Share | |||||
|---|---|---|---|---|---|---|---|---|
| Oct-14 | Oct-13 | Oct-14 | Oct-13 | Oct-14 | Oct-13 | Oct-14 | Oct-13 | |
| Las Vegas | 10.6% | 21.0% | 8.9% | 6.0% | 19.5% | 27.0% | 35.1% | 44.9% |
| Reno** | 6.0% | 16.0% | 4.0% | 4.0% | 10.0% | 20.0% | ||
| Phoenix | 3.7% | 8.4% | 6.2% | 6.9% | 9.9% | 15.3% | 27.7% | 31.6% |
| Sacramento | 6.1% | 13.7% | 6.3% | 5.9% | 12.4% | 19.6% | 20.6% | 23.9% |
| Minneapolis | 2.7% | 5.1% | 9.8% | 16.4% | 12.5% | 21.5% | ||
| Mid-Atlantic | 4.8% | 8.2% | 10.0% | 7.9% | 14.9% | 16.1% | 19.2% | 19.9% |
| Orlando | 5.2% | 15.5% | 26.7% | 20.7% | 31.8% | 36.2% | 41.8% | 47.8% |
| California * | 6.1% | 10.3% | 5.3% | 6.7% | 11.4% | 17.0% | ||
| Bay Area CA* | 3.5% | 7.3% | 2.7% | 3.7% | 6.2% | 11.0% | ||
| So. California* | 5.9% | 10.8% | 4.8% | 6.3% | 10.7% | 17.1% | ||
| Miami MSA SF | 8.3% | 16.3% | 19.5% | 15.1% | 27.8% | 31.4% | 39.3% | 46.4% |
| Miami MSA C/TH | 4.9% | 11.3% | 23.4% | 18.3% | 28.3% | 29.6% | 69.3% | 73.1% |
| Tucson | 26.8% | 32.1% | ||||||
| Toledo | 38.2% | 37.1% | ||||||
| Wichita | 28.9% | 30.5% | ||||||
| Des Moines | 18.8% | 20.2% | ||||||
| Peoria | 22.8% | 21.1% | ||||||
| Georgia*** | 27.8% | N/A | ||||||
| Omaha | 18.5% | 20.0% | ||||||
| Pensacola | 33.5% | 33.7% | ||||||
| Knoxville | 24.7% | 26.5% | ||||||
| Memphis* | 13.3% | 19.8% | ||||||
| Birmingham AL | 15.2% | 21.0% | ||||||
| Springfield IL** | 8.3% | 15.3% | ||||||
| *share of existing home sales, based on property records **Single Family Only ***GAMLS | ||||||||
Comments on October Housing Starts
by Calculated Risk on 11/19/2014 03:58:00 PM
A few key points:
• Housing permits in October were at the highest level since 2008. Last year, in 2013, there was a surge in multi-family permits in October - and that was followed by an increase for starts in November. It looks like that might happen again this year.
• Multi-family completions have increased sharply (2nd graph below). Completions are what matter for apartment market supply, and with more completions it appears that the apartment vacancy rate has reached bottom and even increased a little (but still low). More apartments on the market will probably mean higher vacancy rates and less upward pressure on rents.
• Single family starts are increasing, but are still extremely low (last graph below). As we've been discussing for several years, demographics have been very favorable for apartments (and the housing bust boosted apartments too). However, looking forward, the demographics will become more favorable for home ownership. This is a positive for single family housing and for the overall economy.
On starts: There were 848 thousand total housing starts during the first ten months of 2014 (not seasonally adjusted, NSA), up 9.6% from the 774 thousand during the same period of 2013. Single family starts are up 5%, and multifamily starts up 20%. The key weakness has been in single family starts.
The following table shows the annual housing starts since 2005, and the percent change from the previous year (estimates for 2014). The housing recovery has slowed in 2014, especially for single family starts. However I expect further growth in starts over the next several years.
| Housing Starts (000s) and Annual Change | ||||
|---|---|---|---|---|
| Total | Total % Change | Single | Single % Change | |
| 2005 | 2,068.3 | 5.8% | 1,715.8 | 6.5% |
| 2006 | 1,800.9 | -12.9% | 1,465.4 | -14.6% |
| 2007 | 1,355.0 | -24.8% | 1,046.0 | -28.6% |
| 2008 | 905.5 | -33.2% | 622.0 | -40.5% |
| 2009 | 554.0 | -38.8% | 445.1 | -28.4% |
| 2010 | 586.9 | 5.9% | 471.2 | 5.9% |
| 2011 | 608.8 | 3.7% | 430.6 | -8.6% |
| 2012 | 780.6 | 28.2% | 535.3 | 24.3% |
| 2013 | 924.9 | 18.5% | 617.6 | 15.4% |
| 20141 | 999.0 | 8.0% | 645.0 | 4.5% |
| 1Estimate for 2014 | ||||
This graph shows the month to month comparison between 2013 (blue) and 2014 (red). Starts in 2014 have been above the same month in 2013 for seven consecutive months.
 Click on graph for larger image.
The year-over-year growth will slow in November and December because the comparisons will be more difficult. However it does appear (based on permits) that starts will finish the year strong (like in 2013).
Below is an update to the graph comparing multi-family starts and completions. Since it usually takes over a year on average to complete a multi-family project, there is a lag between multi-family starts and completions. Completions are important because that is new supply added to the market, and starts are important because that is future new supply (units under construction is also important for employment).
These graphs use a 12 month rolling total for NSA starts and completions.
 The blue line is for multifamily starts and the red line is for multifamily completions.
 The rolling 12 month total for starts (blue line) increased steadily over the last few years, and completions (red line) have lagged behind - but completions have been catching up (more deliveries), and will continue to follow starts up (completions lag starts by about 12 months).
Multifamily completions were up more than 50% year-over-year in October, but multi-family starts were down slightly year-over-year (starts are volatile month-to-month).
 The second graph shows single family starts and completions. It usually only takes about 6 months between starting a single family home and completion - so the lines are much closer. The blue line is for single family starts and the red line is for single family completions.
Single family starts are moving up again on a rolling 12 months basis.
Note the exceptionally low level of single family starts and completions. The "wide bottom" was what I was forecasting several years ago, and now I expect several years of increasing single family starts and completions.
FOMC Minutes: "a few expressed concern that inflation might persist below the Committee's objective for quite some time"
by Calculated Risk on 11/19/2014 02:00:00 PM
From the Fed: Minutes of the Federal Open Market Committee, October 28-29, 2014. Excerpts:
In their discussion of the economic situation and the outlook, most meeting participants viewed the information received over the intermeeting period as suggesting that economic activity continued to expand at a moderate pace. Labor market conditions improved somewhat further, with solid job gains and a lower unemployment rate; on balance, participants judged that the underutilization of labor resources was gradually diminishing. Participants generally expected that, over the medium term, real economic activity would increase at a pace sufficient to lead to a further gradual decline in the unemployment rate toward levels consistent with the Committee's objective of maximum employment. Inflation was continuing to run below the Committee's longer-run objective. Market-based measures of inflation compensation declined somewhat, while survey-based measures of longer-term inflation expectations remained stable. Participants anticipated that inflation would be held down over the near term by the decline in energy prices and other factors, but would move toward the Committee's 2 percent goal in coming years, although a few expressed concern that inflation might persist below the Committee's objective for quite some time. Most viewed the risks to the outlook for economic activity and the labor market as nearly balanced. However, a number of participants noted that economic growth over the medium term might be slower than they currently expected if the foreign economic or financial situation deteriorated significantly.
...
In their discussion of communications regarding the path of the federal funds rate over the medium term, meeting participants agreed that the timing of the first increase in the federal funds rate and the appropriate path of the policy rate thereafter would depend on incoming economic data and their implications for the outlook. Most participants judged that it would be helpful to include new language in the Committee's forward guidance to clarify how the Committee's decision about when to begin the policy normalization process will depend on incoming information about the economy. Some participants preferred to eliminate language in the statement indicating that the current target range for the federal funds rate would likely be maintained for a "considerable time" after the end of the asset purchase program. These participants were concerned that such a characterization could be misinterpreted as suggesting that the Committee's decisions would not depend on the incoming data. However, other participants thought that the "considerable time" phrase was useful in communicating the Committee's policy intentions or that additional wording could be used to emphasize the data-dependence of the Committee's decision process. A couple of them noted that the removal of the "considerable time" phrase might be seen as signaling a significant shift in the stance of policy, potentially resulting in an unintended tightening of financial conditions. A couple of others thought that the current forward guidance might be read as suggesting an earlier date of liftoff than was likely to prove appropriate, given the outlook for inflation and the downside risks to the economy associated with the effective lower bound on interest rates. With regard to the pace of interest rate increases after the start of policy normalization, a number of participants thought that it could soon be helpful to clarify the Committee's likely approach. It was noted that communication about post-liftoff policy would pose challenges given the inherent uncertainty of the economic and financial outlook and the Committee's desire to retain flexibility to adjust policy in response to the incoming data. Most participants supported retaining the language in the statement indicating that the Committee anticipates that economic conditions may warrant keeping the target range for the federal funds rate below longer-run normal levels even after employment and inflation are near mandate-consistent levels. However, a couple of participants thought that the language should be amended in light of the prescriptions suggested by many monetary policy rules and the risks associated with keeping interest rates below their longer-run values for an extended period of time.
emphasis added
AIA: Architecture Billings Index shows slower expansion in October
by Calculated Risk on 11/19/2014 11:10:00 AM
Note: This index is a leading indicator primarily for new Commercial Real Estate (CRE) investment.
From AIA: Pace of Demand Slows Slightly, but Positive Outlook for Architecture Billings Index Continues
Headed by the continued strength in the multi-family residential market and the emerging growth for institutional projects, demand for design services continues to be healthy as exhibited in the latest Architecture Billings Index (ABI). As a leading economic indicator of construction activity, the ABI reflects the approximate nine to twelve month lead time between architecture billings and construction spending. The American Institute of Architects (AIA) reported the October ABI score was 53.7, down from a mark of 55.2 in September. This score reflects an increase in design activity (any score above 50 indicates an increase in billings). The new projects inquiry index was 62.7, following a mark of 64.8 the previous month.
The AIA has added a new indicator measuring the trends in new design contracts at architecture firms that can provide a strong signal of the direction of future architecture billings. The score for design contracts in October was 56.4.
“Though it has been slow in emerging, we’re finally seeing some momentum develop in design activity for nonprofits and municipal governments, and as such we’re seeing a new round of activity in the institutional sector,” said AIA Chief Economist Kermit Baker, Hon. AIA, PhD. “It will be interesting to see if and how the results of the mid-term Congressional and gubernatorial elections impact this developing momentum.”
• Regional averages: South (58.4), West (56.1), Midwest (54.4), Northeast (47.0) [three month average]
emphasis added
 Click on graph for larger image.
This graph shows the Architecture Billings Index since 1996. The index was at 53.7 in October, down from 55.2 in September. Anything above 50 indicates expansion in demand for architects' services.
Note: This includes commercial and industrial facilities like hotels and office buildings, multi-family residential, as well as schools, hospitals and other institutions.
According to the AIA, there is an "approximate nine to twelve month lag time between architecture billings and construction spending" on non-residential construction. So the positive readings over the last six months suggest an increase in CRE investment in 2015.
Housing Starts decrease to 1.009 Million Annual Rate in October
by Calculated Risk on 11/19/2014 08:30:00 AM
From the Census Bureau: Permits, Starts and Completions
Housing Starts:
Privately-owned housing starts in October were at a seasonally adjusted annual rate of 1,009,000. This is 2.8 percent below the revised September estimate of 1,038,000, but is 7.8 percent above the October 2013 rate of 936,000.
Single-family housing starts in October were at a rate of 696,000; this is 4.2 percent above the revised September figure of 668,000. The October rate for units in buildings with five units or more was 300,000.
emphasis added
Building Permits:
Privately-owned housing units authorized by building permits in October were at a seasonally adjusted annual rate of 1,080,000. This is 4.8 percent above the revised September rate of 1,031,000 and is 1.2 percent above the October 2013 estimate of 1,067,000.
Single-family authorizations in October were at a rate of 640,000; this is 1.4 percent above the revised September figure of 631,000. Authorizations of units in buildings with five units or more were at a rate of 406,000 in October.
 Click on graph for larger image.
The first graph shows single and multi-family housing starts for the last several years.
Multi-family starts (red, 2+ units) decreased in October (Multi-family is volatile month-to-month). Note that permits were strong for multi-family, so multi-family starts will probably increase in November.
Single-family starts (blue) increased solidly in October.
The second graph shows total and single unit starts since 1968.
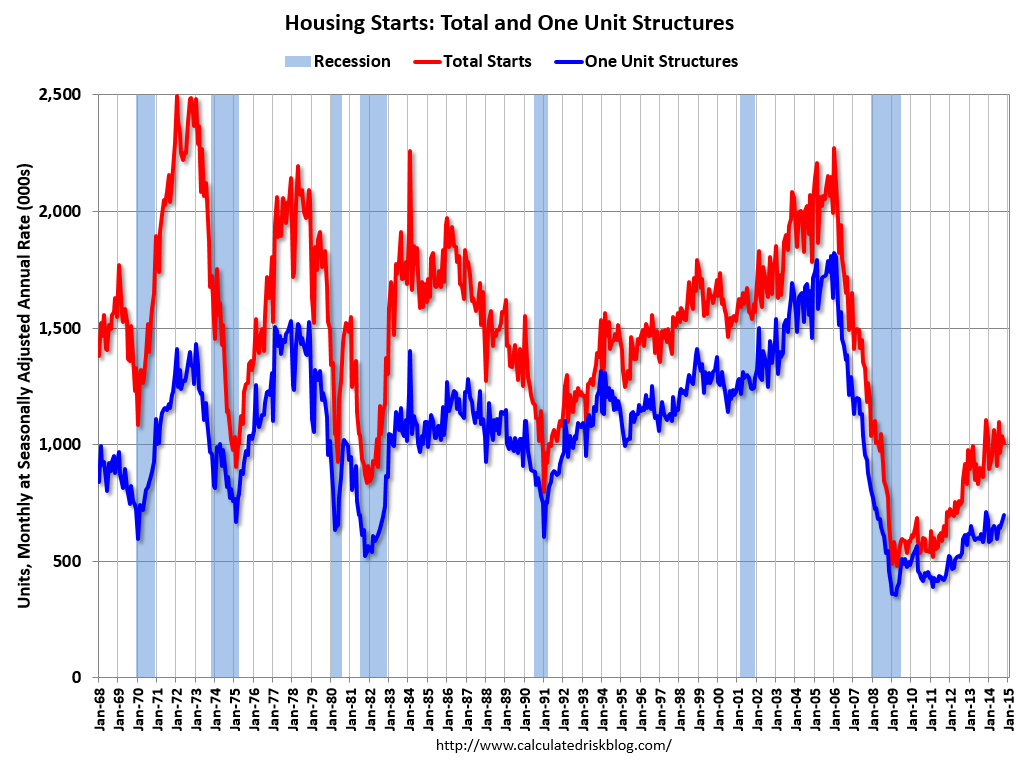 The second graph shows the huge collapse following the housing bubble, and that housing starts have been increasing after moving sideways for about two years and a half years.
 This was below expectations of 1.025 million starts in October, but this was due to the volatile multi-family sector.
Overall this was a solid report, with a solid increase in single family starts, upward revisions to the previous two months, and a solid increase in permits. I'll have more later ...


