by Calculated Risk on 10/28/2014 11:59:00 AM
Tuesday, October 28, 2014
House Prices: Real Prices and Price-to-Rent Ratio in August
I started 2014 expecting a slowdown in year-over-year (YoY) house prices as "For Sale" inventory increases - and the price slowdown is very clear. The Case-Shiller Composite 20 index was up 5.6% YoY in August; the smallest YoY increase since October 2012 (the National index was up 5.1%, also the slowest YoY increase since October 2012.
This slowdown was expected by several key analysts, and I think it is good news. As Zillow chief economist Stan Humphries said today:
“After several months in a row of slowing home value growth, it’s fair to say now the market has officially turned a corner and entered a new phase of the recovery. We’re transitioning away from a period of hot and bothered market activity, characterized by low inventory and rapid price growth, onto a more slow and steady trajectory, which is great news. In housing, boring is better."Boring - in the housing market - would be good!
emphasis added
In the earlier post, I graphed nominal house prices, but it is also important to look at prices in real terms (inflation adjusted). Case-Shiller, CoreLogic and others report nominal house prices. As an example, if a house price was $200,000 in January 2000, the price would be close to $280,000 today adjusted for inflation (40%). That is why the second graph below is important - this shows "real" prices (adjusted for inflation).
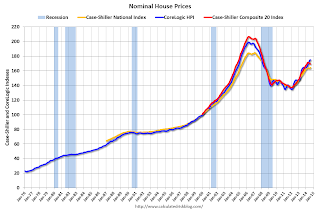
Nominal House Prices
 The first graph shows the monthly Case-Shiller National Index SA, the monthly Case-Shiller Composite 20 SA, and the CoreLogic House Price Indexes (through July) in nominal terms as reported.
In nominal terms, the Case-Shiller National index (SA) is back to February 2005 levels, and the Case-Shiller Composite 20 Index (SA) is back to September 2004 levels, and the CoreLogic index (NSA) is back to February 2005.
Real House Prices
 The second graph shows the same three indexes in real terms (adjusted for inflation using CPI less Shelter). Note: some people use other inflation measures to adjust for real prices.
In real terms, the National index is back to September 2002 levels, the Composite 20 index is back to June 2002, and the CoreLogic index back to March 2003.
In real terms, house prices are back to early '00s levels.
Price-to-Rent
In October 2004, Fed economist John Krainer and researcher Chishen Wei wrote a Fed letter on price to rent ratios: House Prices and Fundamental Value. Kainer and Wei presented a price-to-rent ratio using the OFHEO house price index and the Owners' Equivalent Rent (OER) from the BLS.
 Here is a similar graph using the Case-Shiller National, Composite 20 and CoreLogic House Price Indexes.
This graph shows the price to rent ratio (January 1998 = 1.0).
On a price-to-rent basis, the Case-Shiller National index is back to February 2003 levels, the Composite 20 index is back to September 2002 levels, and the CoreLogic index is back to July 2003.
In real terms, and as a price-to-rent ratio, prices are mostly back to early 2000 levels - and maybe moving a little sideways now.
HVS: Q3 2014 Homeownership and Vacancy Rates
by Calculated Risk on 10/28/2014 10:00:00 AM
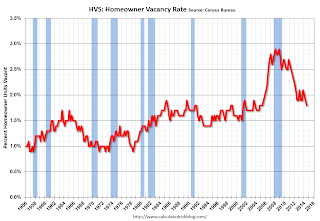
The Census Bureau released the Housing Vacancies and Homeownership report for Q3 2014.
This report is frequently mentioned by analysts and the media to track the homeownership rate, and the homeowner and rental vacancy rates. However, there are serious questions about the accuracy of this survey.
This survey might show the trend, but I wouldn't rely on the absolute numbers. The Census Bureau is investigating the differences between the HVS, ACS and decennial Census, and analysts probably shouldn't use the HVS to estimate the excess vacant supply or household formation, or rely on the homeownership rate, except as a guide to the trend.

The Red dots are the decennial Census homeownership rates for April 1st 1990, 2000 and 2010. The HVS homeownership rate decreased to 64.4% in Q3, from 64.7% in Q2.
I'd put more weight on the decennial Census numbers - and given changing demographics, the homeownership rate is probably close to a bottom.

It isn't really clear what this means. Are these homes becoming rentals?
Once again - this probably shows that the general trend is down, but I wouldn't rely on the absolute numbers.

I think the Reis quarterly survey (large apartment owners only in selected cities) is a much better measure of the rental vacancy rate - and Reis reported that the rental vacancy rate increased slightly in Q3 - and might have bottomed.
The quarterly HVS is the most timely survey on households, but there are many questions about the accuracy of this survey. Unfortunately many analysts still use this survey to estimate the excess vacant supply.
Case-Shiller: National House Price Index increased 5.1% year-over-year in August
by Calculated Risk on 10/28/2014 09:00:00 AM
S&P/Case-Shiller released the monthly Home Price Indices for August ("August" is a 3 month average of June, July and August prices).
This release includes prices for 20 individual cities, two composite indices (for 10 cities and 20 cities) and the new monthly National index.
Note: Case-Shiller reports Not Seasonally Adjusted (NSA), I use the SA data for the graphs.
From S&P: Home Price Gains Fade Further According to the S&P/Case-Shiller Home Price Indices
Data through August 2014, released today by S&P Dow Jones Indices for its S&P/Case-Shiller Home Price Indices ... continue to show a deceleration in home price gains. The 10-City Composite gained 5.5% year-over-year and the 20-City 5.6%, both down from the 6.7% reported for July. The National Index gained 5.1% annually in August compared to 5.6% in July.
On a monthly basis, the National Index and Composite Indices showed a slight increase of 0.2% for the month of August. Detroit led the cities with the gain of 0.8%, followed by Dallas, Denver and Las Vegas at 0.5%. Gains in those cities were offset by a decline of 0.4% in San Francisco followed by declines of 0.1% in Charlotte and San Diego. ...
“The deceleration in home prices continues,” says David M. Blitzer, Chairman of the Index Committee at S&P Dow Jones Indices. “The Sun Belt region reported its worst annual returns since 2012, led by weakness in all three California cities -- Los Angeles, San Francisco and San Diego. Despite the weaker year-over-year numbers, home prices are still showing an overall increase, as the National Index increased for its eighth consecutive month."
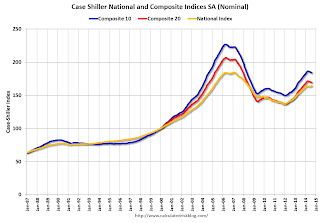
 Click on graph for larger image.
 The first graph shows the nominal seasonally adjusted Composite 10, Composite 20 and National indices (the Composite 20 was started in January 2000).
The Composite 10 index is off 18.8% from the peak, and down 0.2% in August (SA). The Composite 10 is up 22.8% from the post bubble low set in Jan 2012 (SA).
The Composite 20 index is off 17.9% from the peak, and down 0.2% (SA) in August. The Composite 20 is up 23.8% from the post-bubble low set in Jan 2012 (SA).
The National index is off 11.3% from the peak, and up 0.4% (SA) in August. The National index is up 19.7% from the post-bubble low set in Dec 2012 (SA).
 The second graph shows the Year over year change in all three indices.
The Composite 10 SA is up 5.5% compared to August 2013.
The Composite 20 SA is up 5.6% compared to August 2013.
The National index SA is up 5.1% compared to August 2013.
Prices increased (SA) in 8 of the 20 Case-Shiller cities in August seasonally adjusted. (Prices increased in 14 of the 20 cities NSA) Prices in Las Vegas are off 42.6% from the peak, and prices in Denver and Dallas are at new highs (SA).
This was slightly above than the consensus forecast for a 4.9% YoY increase for the National index, and suggests a further slowdown in price increases. I'll have more on house prices later.
Monday, October 27, 2014
Tuesday: Case-Shiller House Prices, Durable Goods, and much more
by Calculated Risk on 10/27/2014 07:46:00 PM
From Nick Timiraos at the WSJ: Gas at $3 Carries Rewards—and Risks
Gasoline prices have dropped below $3 a gallon at most U.S. gas stations, delivering a welcome lift to American consumers and retailers heading into the holidays. But the related oil-price drop has a thorny underside: It is threatening to slow the nation’s energy boom and hit the broader economy.I'll take the rewards! Besides $80 per barrel isn't cheap. In January 2001, oil was under $30 per barrel (about $40 adjusted for inflation), and then increased more than four-fold to $134 per barrel in 2008 - before crashing during the financial crisis.
Tuesday:
• At 8:30 AM ET, Durable Goods Orders for September from the Census Bureau. The consensus is for a 0.9% increase in durable goods orders.
• At 9:00 AM, the S&P/Case-Shiller House Price Index for August. Although this is the August report, it is really a 3 month average of June, July and August prices. The consensus is for a 4.9% year-over-year increase in the National Index for August , down from 5.7% in July (consensus 5.8% increase in Comp 20). The Zillow forecast is for the Composite 20 to increase 5.7% year-over-year in August, and for prices to increase 0.1% month-to-month seasonally adjusted.
• At 10:00 AM, the Richmond Fed Survey of Manufacturing Activity for October.
• Also at 10:00 AM, the Conference Board's consumer confidence index for October. The consensus is for the index to increase to 87.2 from 86.0.
• Also at 10:00 AM, the Q3 Housing Vacancies and Homeownership report from the Census Bureau. This report is frequently mentioned by analysts and the media to report on the homeownership rate, and the homeowner and rental vacancy rates. However, this report doesn't track with other measures (like the decennial Census and the ACS).
• During the day, the Q3 NMHC Apartment Tightness Index.
Vehicle Sales Forecasts: Over 16 Million SAAR again in October
by Calculated Risk on 10/27/2014 03:35:00 PM
The automakers will report October vehicle sales on Monday, Nov 3rd. Sales in September were at 16.34 million on a seasonally adjusted annual rate basis (SAAR), and it appears sales in October will be solidly above 16 million SAAR again.
Note: There were the 27 selling days in October this year compared to 27 (same) last year.
Here are a few forecasts:
From WardsAuto: Forecast: October Sales Steady Before End-of-Year Spike
A WardsAuto forecast calls for U.S. automakers to maintain solid year-over year gains in October, delivering 1.28 million light vehicles over 27 selling days. The resulting daily sales rate of 47,356 units represents a 6.5% improvement over same-month year-ago (also 27 days) and an 8.2% month-to-month drop from September (24 days), in line with seasonal expectations. The forecast equates to a 16.4 million-unit SAAR, a tick above the 16.3 million year-to-date SAAR through September.From J.D. Power: New-Vehicle Retail Sales On Pace for 1.1 Million, the Strongest October since 2004; Record-Breaking Consumer Spending for the Month
New-vehicle retail sales in October 2014 are projected to come in at 1.1 million units, a 6 percent increase, compared with October 2013. The retail seasonally adjusted annualized rate (SAAR) in October is expected to be 13.6 million units, 0.7 million units stronger than October 2013.From Kelley Blue Book: New-Vehicle Sales To Jump 5.4 Percent In October, According To Kelley Blue Book
...
“The industry continues to demonstrate strong sales growth and robust transaction prices, resulting in another record-breaking month for industry consumer spending,” said John Humphrey, senior vice president of the global automotive practice at J.D. Power. [Total forecast 16.3 million SAAR]
New-vehicle sales are expected to increase 5.4 percent year-over-year to a total of 1.27 million units ... The seasonally adjusted annual rate (SAAR) for October 2014 is estimated to be 16.3 million, up from 15.3 million in October 2013 and even with 16.3 million in September 2014.From TrueCar: TrueCar Forecasts Strong Sales in October; Up 5.9% Compared to Last Year
Seasonally Adjusted Annualized Rate ("SAAR") for October of 16.3 million new vehicle sales.Another solid month for auto sales, and this should be the best year since 2006.
"Industry-wide, we're looking at the strongest October since 2004, with incentive spending at healthy levels, and on-track to finish the year at 16.4 million units." [said John Krafcik, president of TrueCar].


