by Calculated Risk on 10/24/2014 08:50:00 PM
Friday, October 24, 2014
Merrill Lynch: FOMC Preview
From Merrill Lynch:
The October FOMC meeting is likely to see the end of QE3 buying, as the Fed tapers the final $15bn in asset purchases. ... Tapering has been largely contingent on an improving labor market, and that has generally continued. The FOMC also has indicated multiple times that they are likely to end QE3 in October. Thus, it would take a significant adverse shock to change that plan, in our view.I'll post a preview this weekend, but it seems QE3 will end ... and the FOMC statement will be shorter!
As for the statement language, we expect the “significant underutilization” language to once again remain in place — although we see a modest chance that is downgraded, say to “elevated underutilization.” Meanwhile, the likelihood of changing the “considerable time” language is much more evenly split. Our base case remains no change in October, largely because there is no urgent need to revise, especially with the increase in downside risks to the outlook and heightened market volatility since the last meeting. However, there is general dissatisfaction on the FOMC with this phrase, and Fed officials have had another month and a half to consider alternatives. With no press conference scheduled after this meeting, the Committee may opt for re-examining the forward guidance language more comprehensively at their December meeting.
Perhaps most notable at this meeting may be the number and nature of dissents. We see a high probability of hawkish dissents from Dallas’s Fisher and Philadelphia’s Plosser. In our view, there is some chance the FOMC statement will note a bit more concern about downside risks to inflation — a reflection of recent data, the drop in breakevens, the strong US dollar, and disinflationary forces abroad. Should the Committee opt not to add such language, a dovish dissent from Minneapolis’s Kocherlakota becomes a risk. ... We continue to recommend focusing on the statement language and prepared remarks from Chair Yellen and other key Fed officials to understand the views of the majority of voters, who favor a patient and gradual exit process.
Bank Failure #16 in 2014: National Republic Bank of Chicago
by Calculated Risk on 10/24/2014 06:41:00 PM
From the FDIC: State Bank of Texas, Dallas, Texas, Assumes All of the Deposits of the National Republic Bank of Chicago, Chicago, Illinois
As of June 30, 2014, The National Republic Bank of Chicago had approximately $954.4 million in total assets and $915.3 million in total deposits. ... The FDIC estimates that the cost to the Deposit Insurance Fund (DIF) will be $111.6 million. ... The National Republic Bank of Chicago is the 16th FDIC-insured institution to fail in the nation this year, and the fifth in Illinois.Bank failure friday two weeks in a row!
Lawler on New Home Sales: Silly-Looking August Guess Revised Down Sharply in the West – As Expected
by Calculated Risk on 10/24/2014 03:30:00 PM
From housing economist Tom Lawler:
Census “guesstimated” that new SF home sales ran at a seasonally adjusted annual rate of 467,000 in September, up 0.2% from August’s downwardly-revised (by 7.5% to 466,000) pace. Sales estimates for June and July were also revised downward (by 2.4% and 5.4%, respectively). Not surprisingly (see LEHC, 9/24/2014), the biggest downward revision in sales for August was in the West region, where sales were revised downward by almost 20%.
Census also estimated that the inventory of new SF homes for sale at the end of September was 207,000 on a seasonally adjusted basis, up 1.5% from August’s upwardly revised (to 204,000 from 203,000) level and up 13.1% from a year ago. Census estimated that the median new SF home sales price last month was $259,000, down 4% from last September.
| Census Estimates of New SF Home Sales in August (SAAR) | |||
|---|---|---|---|
| Preliminary | First Revision | % Difference | |
| US | 504,000 | 466,000 | -7.5% |
| Northeast | 31,000 | 30,000 | -3.2% |
| Midwest | 58,000 | 57,000 | -1.7% |
| South | 262,000 | 256,000 | -2.3% |
| West | 153,000 | 123,000 | -19.6% |
Here are Census’ estimates of new SF home sales for the first nine months of 2014 compared to the first nine months of 2013 (not seasonally adjusted).
| Census Estimates of New SF Home Sales, Jan - Sep (NSA) | |||
|---|---|---|---|
| 2014 | 2013 | % Change* | |
| US | 337,000 | 331,000 | 1.7% |
| Northeast | 21,000 | 24,000 | -12.5% |
| Midwest | 47,000 | 47,000 | -1.2% |
| South | 187,000 | 175,000 | 6.8% |
| West | 82,000 | 85,000 | -3.2% |
| *Note: Census only shows home sales rounded to the nearest thousand, but % changes are reported based on unrounded estimates | |||
New SF home sales so far this year have fallen well short of consensus industry expectations at the beginning of the year. A major reason appears to be weakness sales to first-time home buyers, partly because of tight credit, partly because of financial “issues” for many younger adults, but also partly because many builders have trouble meeting their high return targets for communities with smaller, lower-price homes that would normally be targeted for first-time buyers.
As an example, home builder Pulte noted this morning that given its return targets “most” of its current land development was going to communities focused on the move-up and active adult markets, as in many areas there is not enough “pricing power” in the first-time buyer market for the company to meet its return targets.
Comments on September New Home Sales
by Calculated Risk on 10/24/2014 12:31:00 PM
The new home sales report for September was slightly above expectations at 467 thousand on a seasonally adjusted annual rate basis (SAAR). With the downward revision to August sales, sales for September were at the the highest sales rate since July 2008.
Sales for the previous three months (June, July and August) were revised down.
Earlier: New Home Sales increased slightly to 467,000 Annual Rate in September
The Census Bureau reported that new home sales this year, through September, were 338,000, Not seasonally adjusted (NSA). That is up 2.4% from 330,000 during the same period of 2013 (NSA). Not much of a gain from last year. Right now it looks like sales will barely be up this year (maybe 3% or so for the year).
Sales were up 17.0% year-over-year in September - however sales declined sharply in Q3 2013 as mortgage rates increased - so this was an easy comparison. The comparisons for Q4 will be more difficult.

This graph shows new home sales for 2013 and 2014 by month (Seasonally Adjusted Annual Rate).
The year-over-year gain will probably be smaller in Q4, but I expect sales to be up for the quarter and for the year.
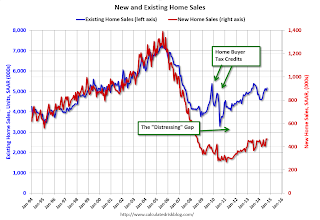
And here is another update to the "distressing gap" graph that I first started posting several years ago to show the emerging gap caused by distressed sales. Now I'm looking for the gap to close over the next few years.

Following the housing bubble and bust, the "distressing gap" appeared mostly because of distressed sales.
I expect existing home sales to mostly move sideways (distressed sales will continue to decline and be somewhat offset by more conventional / equity sales). And I expect this gap to slowly close, mostly from an increase in new home sales.
Note: Existing home sales are counted when transactions are closed, and new home sales are counted when contracts are signed. So the timing of sales is different.
New Home Sales increased slightly to 467,000 Annual Rate in September
by Calculated Risk on 10/24/2014 10:00:00 AM
The Census Bureau reports New Home Sales in September were at a seasonally adjusted annual rate (SAAR) of 467 thousand.
August sales were revised down from 504 thousand to 466 thousand, and July sales were revised down from 427 thousand to 404 thousand.
"Sales of new single-family houses in September 2014 were at a seasonally adjusted annual rate of 467,000, according to estimates released jointly today by the U.S. Census Bureau and the Department of Housing and Urban Development. This is 0.2 percent above the revised August rate of 466,000 and is 17.0 percent above the September 2013 estimate of 399,000."
 Click on graph for larger image.
The first graph shows New Home Sales vs. recessions since 1963. The dashed line is the current sales rate.
Even with the increase in sales over the previous two years, new home sales are still close to the bottom for previous recessions.
The second graph shows New Home Months of Supply.
 The months of supply was unchanged in September at 5.3 months.
 The all time record was 12.1 months of supply in January 2009.
This is now in the normal range (less than 6 months supply is normal).
"The seasonally adjusted estimate of new houses for sale at the end of September was 207,000. This represents a supply of 5.3 months at the current sales rate."
 On inventory, according to the Census Bureau:
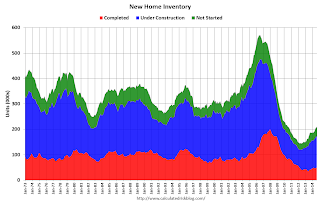
 "A house is considered for sale when a permit to build has been issued in permit-issuing places or work has begun on the footings or foundation in nonpermit areas and a sales contract has not been signed nor a deposit accepted."Starting in 1973 the Census Bureau broke this down into three categories: Not Started, Under Construction, and Completed.
The third graph shows the three categories of inventory starting in 1973.
The inventory of completed homes for sale is still low, and the combined total of completed and under construction is also low.
 The last graph shows sales NSA (monthly sales, not seasonally adjusted annual rate).
In September 2014 (red column), 38 thousand new homes were sold (NSA). Last year 31 thousand homes were sold in September. This was the best September since 2007.
The high for September was 99 thousand in 2005, and the low for September was 24 thousand in 2011.
This was close to expectations of 460,000 sales in September, although there were downward revisions to sales in June, July and August.
I'll have more later today.


