by Calculated Risk on 10/21/2014 01:31:00 PM
Tuesday, October 21, 2014
BLS: Thirty-one States had Unemployment Rate Decreases in September
From the BLS: Regional and State Employment and Unemployment Summary
Regional and state unemployment rates were generally little changed in September. Thirty-one states had unemployment rate decreases from August, 8 states had increases, and 11 states and the District of Columbia had no change, the U.S. Bureau of Labor Statistics reported today.
...
Georgia had the highest unemployment rate among the states in September, 7.9 percent. North Dakota again had the lowest jobless rate, 2.8 percent.
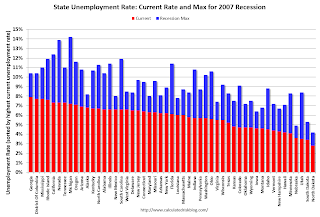
 Click on graph for larger image.
This graph shows the current unemployment rate for each state (red), and the max during the recession (blue). All states are well below the maximum unemployment rate for the recession.
The size of the blue bar indicates the amount of improvement.
The states are ranked by the highest current unemployment rate. Georgia had the highest unemployment rate in September at 7.9%.
 The second graph shows the number of states with unemployment rates at or above certain levels since January 2006. At the worst of the employment recession, there were 10 states with an unemployment rate at or above 11% (red).
Currently no state has an unemployment rate at or above 8% (light blue); Nine states are still at or above 7% (dark blue).
A Few Comments on September Existing Home Sales
by Calculated Risk on 10/21/2014 11:02:00 AM
A few comments ...
• Once again housing economist Tom Lawler's forecast of 5.14 million SAAR was closer than the consensus (5.05 million) to the NAR reported sales (5.17 million). It is getting harder for Lawler to beat the "consensus" because it appears several analysts are waiting for Lawler's estimate before submitting their own!
• "The sky is falling! The sky is falling!" Maybe not ... Remember those analysts who incorrectly claimed that declining year-over-year existing home sales were a sign that the "housing recovery" was over? That was wrong, and I correctly pointed out: 1) the "housing recovery" is mostly new home sales and housing starts - not existing home sales, 2) declining overall existing home sales were a positive if the decline was related to fewer distressed sales.
• The most important number in the NAR report each month is inventory. This morning the NAR reported that inventory was up 6.0% year-over-year in September. It is important to note that the NAR inventory data is "noisy" and difficult to forecast based on other data.
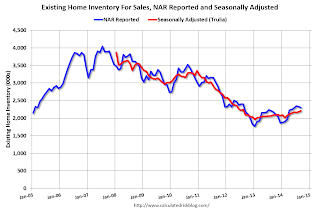
The headline NAR inventory number is not seasonally adjusted, even though there is a clear seasonal pattern. Trulia chief economist Jed Kolko has sent me the seasonally adjusted inventory. NOTE: The NAR does provide a seasonally adjusted months-of-supply, although that is in the supplemental data.

This shows that inventory bottomed in January 2013 (on a seasonally adjusted basis), and inventory is now up about 12.5% from the bottom. On a seasonally adjusted basis, inventory was up 1.4% in September compared to August.
Important: The NAR reports active listings, and although there is some variability across the country in what is considered active, many "contingent short sales" are not included. "Contingent short sales" are strange listings since the listings were frequently NEVER on the market (they were listed as contingent), and they hang around for a long time - they are probably more closely related to shadow inventory than active inventory. However when we compare inventory to 2005, we need to remember there were no "short sale contingent" listings in 2005. In the areas I track, the number of "short sale contingent" listings is also down sharply year-over-year.
And it appears investor buying is declining year-over-year. From the NAR:
All-cash sales were 24 percent of transactions in September, up slightly from August (23 percent) but down from 33 percent in September of last year. Individual investors, who account for many cash sales, purchased 14 percent of homes in September, up from 12 percent last month but below September 2013 (19 percent). Sixty-three percent of investors paid cash in September.And another key point: The NAR reported total sales were down 1.7% from September 2013, but normal equity sales were probably up year-over-year, and distressed sales down sharply. From the NAR (from a survey that is far from perfect):
Distressed homes – foreclosures and short sales – increased slightly in September to 10 percent from 8 percent in August, but are down from 14 percent a year ago. Seven percent of September sales were foreclosures and 3 percent were short sales.Last year in September the NAR reported that 14% of sales were distressed sales.
A rough estimate: Sales in September 2013 were reported at 5.26 million SAAR with 14% distressed. That gives 740 thousand distressed (annual rate), and 4.52 million equity / non-distressed. In September 2014, sales were 5.17 million SAAR, with 10% distressed. That gives 520 thousand distressed - a decline of about 30% from September 2013 - and 4.65 million equity. Although this survey isn't perfect, this suggests distressed sales were down sharply - and normal sales up slightly.
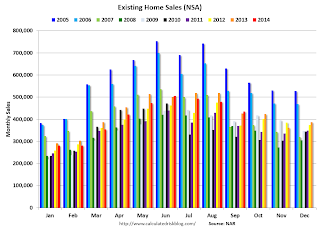
The following graph shows existing home sales Not Seasonally Adjusted (NSA).
 Click on graph for larger image.
Sales NSA in September (red column) were at the highest level for September since 2006.
Overall this was a solid report.
Earlier:
• Existing Home Sales in September: 5.17 million SAAR, Inventory up 6.0% Year-over-year
Existing Home Sales in September: 5.17 million SAAR, Inventory up 6.0% Year-over-year
by Calculated Risk on 10/21/2014 10:00:00 AM
The NAR reports: Existing-Home Sales Rebound in September
Total existing-home sales, which are completed transactions that include single-family homes, townhomes, condominiums and co-ops, increased 2.4 percent to a seasonally adjusted annual rate of 5.17 million in September from 5.05 million in August. Sales are now at their highest pace of 2014, but still remain 1.7 percent below the 5.26 million-unit level from last September. ...
Total housing inventory at the end of September fell 1.3 percent to 2.30 million existing homes available for sale, which represents a 5.3-month supply at the current sales pace. Despite fewer homes for sale in September, unsold inventory is still 6.0 percent higher than a year ago, when there were 2.17 million existing homes available for sale.
 Click on graph for larger image.
This graph shows existing home sales, on a Seasonally Adjusted Annual Rate (SAAR) basis since 1993.
Sales in September (5.17 million SAAR) were 2.4% higher than last month, and were 1.7% below the September 2013 rate.
The second graph shows nationwide inventory for existing homes.
 According to the NAR, inventory decreased to 2.30 million in September from 2.33 million in August. Headline inventory is not seasonally adjusted, and inventory usually increases from the seasonal lows in December and January, and peaks in mid-to-late summer.
The third graph shows the year-over-year (YoY) change in reported existing home inventory and months-of-supply. Since inventory is not seasonally adjusted, it really helps to look at the YoY change. Note: Months-of-supply is based on the seasonally adjusted sales and not seasonally adjusted inventory.
 Inventory increased 6.0% year-over-year in September compared to September 2013.
 Months of supply was at 5.3 months in September.
This was above expectations of sales of 5.09 million. For existing home sales, the key number is inventory - and inventory is still low, but up year-over-year. I'll have more later ...
Monday, October 20, 2014
Tuesday: Existing Home Sales
by Calculated Risk on 10/20/2014 08:09:00 PM
From Dina ElBoghdady at the WaPo: How a top housing regulator plans to make it easier to get a mortgage. Excerpts:
It’s unclear if Watt's downpayment plan will do much to ease access to credit. The average downpayment remains lower today than it was in more normal, pre-housing bubble times, said Sam Khater, chief deputy economist at CoreLogic. That’s because the Federal Housing Administration – which backs loans with as little as 5 percent down -- has a larger share of the mortgage market than usual, Khater said. Having Fannie and Freddie also accept downpayments as low as 5 percent would only help on the fringes, Khater said.From David Stevens, MBA President: MBA’s Stevens Applauds FHFA Steps to Ease Credit for Homebuyers
...
Today, the average credit score on a loan backed by Fannie and Freddie is close to 745, versus about 710 in the early 2000s, according to Moody’s Analytics.
“Offering lenders better clarity around representation and warranty requirements will ensure lenders are accountable for any material mistakes they may make in the loan process, yet acknowledges the fact that minor, immaterial loan defects should not automatically trigger a repurchase request. As a result, lenders will be more confident in offering mortgages to qualified borrowers within the full boundaries of the GSEs’ credit requirements.Tuesday:
• At 10:00 AM, Existing Home Sales for September from the National Association of Realtors (NAR). The consensus is for sales of 5.09 million on seasonally adjusted annual rate (SAAR) basis. Sales in August were at a 5.05 million SAAR. Economist Tom Lawler estimates the NAR will report sales of 5.14 million SAAR. A key will be the reported year-over-year increase in inventory of homes for sale.
• Also at 10:00 AM, Regional and State Employment and Unemployment (Monthly) for September 2014
Lawler: Updated Table of Distressed and All-Cash Share for September
by Calculated Risk on 10/20/2014 04:22:00 PM
CR Note: Existing Home Sales for September will be released tomorrow by the National Association of Realtors (NAR). The consensus is for sales of 5.09 million on seasonally adjusted annual rate (SAAR) basis. Sales in August were at a 5.05 million SAAR. Economist Tom Lawler estimates the NAR will report sales of 5.14 million SAAR.
Housing economist Tom Lawler sent me the updated table below of short sales, foreclosures and cash buyers for several selected cities in September. Lawler notes: "Note the jump in the foreclosure sales share in Orlando."
On distressed: Total "distressed" share is down in these markets due to a decline in short sales.
Short sales are down in all these areas.
Foreclosures are up slightly in several of these areas - and up significantly in Orlando.
The All Cash Share (last two columns) is mostly declining year-over-year. As investors pull back, the share of all cash buyers will probably continue to decline.
| Short Sales Share | Foreclosure Sales Share | Total "Distressed" Share | All Cash Share | |||||
|---|---|---|---|---|---|---|---|---|
| Sep-14 | Sep-13 | Sep-14 | Sep-13 | Sep-14 | Sep-13 | Sep-14 | Sep-13 | |
| Las Vegas | 10.4% | 23.0% | 8.8% | 7.0% | 19.2% | 30.0% | 34.3% | 47.2% |
| Reno** | 7.0% | 20.0% | 7.0% | 5.0% | 14.0% | 25.0% | ||
| Phoenix | 3.8% | 8.8% | 5.8% | 8.0% | 9.6% | 16.8% | 25.7% | 33.4% |
| Sacramento | 5.3% | 12.1% | 6.5% | 3.9% | 11.8% | 16.0% | 19.4% | 23.6% |
| Minneapolis | 3.4% | 6.0% | 9.4% | 16.0% | 12.8% | 22.0% | ||
| Mid-Atlantic | 5.5% | 7.7% | 9.7% | 8.2% | 15.2% | 15.9% | 19.1% | 18.4% |
| Orlando | 7.1% | 18.0% | 24.8% | 18.0% | 31.8% | 36.0% | 41.9% | 43.5% |
| California * | 5.9% | 10.8% | 5.3% | 7.1% | 11.2% | 17.9% | ||
| Bay Area CA* | 3.6% | 7.5% | 2.8% | 3.6% | 6.4% | 11.1% | 20.9% | 23.3% |
| So. California* | 6.0% | 10.9% | 4.7% | 6.4% | 10.7% | 17.3% | 24.3% | 28.7% |
| Hampton Roads | 19.6% | 26.1% | ||||||
| Tucson | 26.7% | 29.8% | ||||||
| Toledo | 31.4% | 38.1% | ||||||
| Wichita | 27.8% | 28.6% | ||||||
| Des Moines | 16.8% | 19.2% | ||||||
| Peoria | 24.7% | 20.7% | ||||||
| Georgia*** | 27.4% | N/A | ||||||
| Omaha | 19.9% | 19.1% | ||||||
| Pensacola | 29.2% | 27.3% | ||||||
| Memphis* | 11.7% | 16.5% | ||||||
| Springfield IL** | 9.5% | 14.1% | 22.6% | N/A | ||||
| *share of existing home sales, based on property records **Single Family Only ***GAMLS | ||||||||


