by Calculated Risk on 8/26/2014 08:31:00 PM
Tuesday, August 26, 2014
Zillow: Case-Shiller House Price Index expected to slow further year-over-year in July
The Case-Shiller house price indexes for June were released this morning. Zillow has started forecasting Case-Shiller a month early - and I like to check the Zillow forecasts since they have been pretty close.
From Zillow: Case-Shiller Slowdown Forecasted to Continue
The Case-Shiller data for June 2014 came out this morning, and based on this information and the July 2014 Zillow Home Value Index (ZHVI, released August 21), we predict that next month’s Case-Shiller data (July 2014) will show that the non-seasonally adjusted (NSA) 20-City Composite Home Price Index increased by 7.0 percent and the NSA 10-City Composite Home Price Index increased by 6.9 percent on a year-over-year basis. The seasonally adjusted (SA) month-over-month change from June to July will be 0.1 percent for the 20-City Composite Index and flat for the 10-City Composite Home Price Index (SA). All forecasts are shown in the table below. Officially, the Case-Shiller Composite Home Price Indices for July will not be released until Tuesday, September 30.So the Case-Shiller index will probably show a lower year-over-year gain in July than in June (8.1% year-over-year).
| Zillow July 2014 Forecast for Case-Shiller Index | |||||
|---|---|---|---|---|---|
| Case Shiller Composite 10 | Case Shiller Composite 20 | ||||
| NSA | SA | NSA | SA | ||
| Case Shiller (year ago) | July 2013 | 176.39 | 172.88 | 162.38 | 158.96 |
| Case-Shiller (last month) | June 2014 | 187.19 | 185.57 | 172.33 | 170.69 |
| Zillow Forecast | YoY | 6.9% | 6.9% | 7.0% | 7.0% |
| MoM | 0.7% | 0.0% | 0.8% | 0.1% | |
| Zillow Forecasts1 | 188.5 | 185.2 | 173.7 | 170.5 | |
| Current Post Bubble Low | 146.45 | 149.91 | 134.07 | 137.13 | |
| Date of Post Bubble Low | Mar-12 | Jan-12 | Mar-12 | Jan-12 | |
| Above Post Bubble Low | 28.7% | 23.5% | 29.6% | 24.3% | |
| 1Estimate based on Year-over-year and Month-over-month Zillow forecasts | |||||
A few comments on the Seasonal Pattern for House Prices
by Calculated Risk on 8/26/2014 04:45:00 PM
• Starting this month, S&P is releasing the Case-Shiller National Index on a monthly basis. This probably means most reporting of a "headline number" will be switched from the Case-Shiller Composite 20 to the National Index.
• On a method to improve the seasonal factors, see Trulia chief economist Jed Kolko's article "Let’s Improve, Not Ignore, Seasonal Adjustment of Housing Data"
There has always been a clear seasonal pattern for house prices, but the seasonal differences have been more pronounced since the housing bust.
Even in normal times house prices tend to be stronger in the spring and early summer than in the fall and winter. Recently there has been a larger than normal seasonal pattern mostly because conventional sales are following the normal pattern (more sales in the spring and summer), but distressed sales (foreclosures and short sales) happen all year. So distressed sales have had a larger negative impact on prices in the fall and winter.
Note: I was one of several people to question the change in the seasonal factor (here is a post in 2009) - and this led to S&P Case-Shiller questioning the seasonal factor too (from April 2010).

This graph shows the month-to-month change in the CoreLogic and NSA Case-Shiller National index since 1987 (both through Jnue). The seasonal pattern was smaller back in the '90s and early '00s, and increased since the bubble burst.
It appears we've already seen the strongest month this year (NSA) for both Case-Shiller NSA and CoreLogic. This suggests both indexes will turn negative seasonally (NSA) earlier this year than the previous two years - perhaps in the August reports.
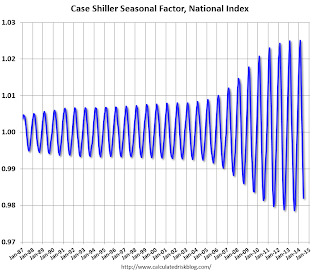
It appears the seasonal factor has started to decrease, and I expect that over the next several years - as the percent of distressed sales declines further and recent history is included in the factors - the seasonal factors will move back towards more normal levels (Kolko's article has more on this).
Zillow: Negative Equity declines further in Q2 2014
by Calculated Risk on 8/26/2014 02:11:00 PM
From Zillow: High Negative Equity Causing Generational Housing Gridlock
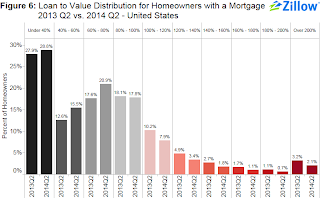
According to the second quarter Zillow Negative Equity Report, the national negative equity rate continued to decline in 2014 Q2, falling to 17 percent, down 14.4 percentage points from its peak (31.4 percent) in the first quarter of 2012. Negative equity has fallen for nine consecutive quarters as home values have risen. However, more than 8.7 million homeowners with a mortgage still remain underwaterThe following graph from Zillow shows negative equity by Loan-to-Value (LTV) in Q2 2014 compared to Q2 2013.
emphasis added
 Click on graph for larger image.
From Zillow:
Figure 6 shows the loan-to-value (LTV) distribution for homeowners with a mortgage in 2014 Q2 versus 2013 Q2. The bulk of underwater homeowners, roughly 7.9 percent, are underwater by up to 20 percent of their loan value and will soon cross over into positive equity territory.Almost half of the borrowers with negative equity have a LTV of 100% to 120% (7.9% in Q2 2014). Most of these borrowers are current on their mortgages - and they have probably either refinanced with HARP or the loans are well seasoned (most of these properties were purchased in the 2004 through 2006 period, so borrowers have been current for eight years or so). In a few years, these borrowers will have positive equity.
The key concern is all those borrowers with LTVs above 140% (about 5.7% of properties with a mortgage according to Zillow). It will take many years to return to positive equity ... and a large percentage of these properties will eventually be distressed sales (short sales or foreclosures).
Note: CoreLogic will release their Q2 negative equity report in the next couple of weeks. For Q1, CoreLogic reported there were 6.3 million properties with negative equity, and that will be down further in Q2 2014.
House Prices: Better Seasonal Adjustment; Real Prices and Price-to-Rent Ratio Decline in June
by Calculated Risk on 8/26/2014 11:22:00 AM
This morning, S&P reported that the Composite 20 index declined 0.2% in June seasonally adjusted. However, it appears the seasonal adjustment has been distorted by the high level of distressed sales in recent years. Trulia's Jed Kolko wrote last month: "Let’s Improve, Not Ignore, Seasonal Adjustment of Housing Data"
The housing crisis substantially changed the seasonal pattern of housing activity: relative to conventional home sales, which peak in summer, distressed home sales are more evenly spread throughout the year and sell at a discount. As a result, in years when distressed sales constitute a larger share of overall sales, the seasonal swings in home prices get bigger while the seasonal swings in sales volumes get smaller.
Sharply changing seasonal patterns create problems for seasonal adjustment methods, which typically estimate seasonal adjustment factors by averaging several years’ worth of observed seasonal patterns. A sharp but ultimately temporary change in the seasonal pattern for housing activity affects seasonal adjustment factors more gradually and for more years than it should. Despite the recent normalizing of the housing market, seasonal adjustment factors are still based, in part, on patterns observed at the height of the foreclosure crisis, causing home price indices to be over-adjusted in some months and under-adjusted in others.
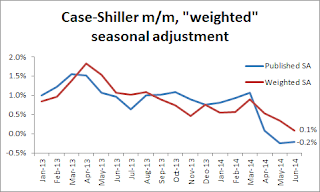 Kolko proposed a better seasonal adjustment:
This graph from Kolko shows the weighted seasonal adjustment (see Kolko's article for a description of his method). Kolko calculates that prices increased 0.1% on a weighted seasonal adjustment basis in June.
I've been expecting a slowdown in year-over-year prices as "For Sale" inventory increases, and the slowdown is here! The Case-Shiller Composite 20 index was up 8.1% year-over-year in June; the smallest year-over-year increase since December 2012.
This is still a very strong year-over-year change, but on a seasonally adjusted monthly basis, the Case-Shiller Composite 20 index was down 0.2% in June (the second monthly decline in a row), and on a weighted seasonal adjusted basis (Kolko's method), the Composite 20 index was only up 0.1% in June. This suggests price increases have slowed sharply in recent months.
On a real basis (inflation adjusted), prices actually declined for the third consecutive month. The price-rent ratio also declined in June for the Case-Shiller Composite 20 index.
It is important to look at prices in real terms (inflation adjusted). Case-Shiller, CoreLogic and others report nominal house prices. As an example, if a house price was $200,000 in January 2000, the price would be close to $280,000 today adjusted for inflation (40%). That is why the second graph below is important - this shows "real" prices (adjusted for inflation).
Nominal House Prices
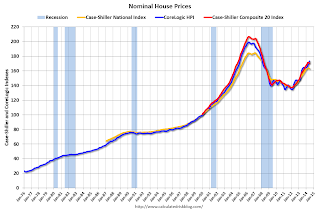 The first graph shows the monthly Case-Shiller National Index SA, and the Case-Shiller Composite 20 SA and CoreLogic House Price Indexes (through June) in nominal terms as reported.
In nominal terms, the Case-Shiller National index (SA) is back to early 2005 levels (and also back up to July 2008), and the Case-Shiller Composite 20 Index (SA) is back to September 2004 levels, and the CoreLogic index (NSA) is back to January 2005.
Real House Prices
 The second graph shows the same three indexes in real terms (adjusted for inflation using CPI less Shelter). Note: some people use other inflation measures to adjust for real prices.
In real terms, the National index is back to June 2002 levels, the Composite 20 index is back to July 2002, and the CoreLogic index back to February 2003.
In real terms, house prices are back to early '00s levels.
Price-to-Rent
In October 2004, Fed economist John Krainer and researcher Chishen Wei wrote a Fed letter on price to rent ratios: House Prices and Fundamental Value. Kainer and Wei presented a price-to-rent ratio using the OFHEO house price index and the Owners' Equivalent Rent (OER) from the BLS.
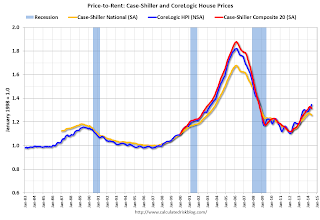 Here is a similar graph using the Case-Shiller National, Composite 20 and CoreLogic House Price Indexes.
This graph shows the price to rent ratio (January 1998 = 1.0).
On a price-to-rent basis, the Case-Shiller National index is back to January 2003 levels, the Composite 20 index is back to October 2002 levels, and the CoreLogic index is back to June 2003.
In real terms, and as a price-to-rent ratio, prices are mostly back to early 2000 levels. And real prices (and the price-to-rent ratio) have declined for three consecutive months using Case-Shiller National and Comp 20 indexes.
Case-Shiller: Comp 20 House Prices increased 8.1% year-over-year in June
by Calculated Risk on 8/26/2014 09:17:00 AM
S&P/Case-Shiller released the monthly Home Price Indices for June ("June" is a 3 month average of April, May and June prices).
This release includes prices for 20 individual cities, and two composite indices (for 10 cities and 20 cities) and the National index.
Note: Case-Shiller reports Not Seasonally Adjusted (NSA), I use the SA data for the graphs.
From S&P: Wide Spread Slowdown in Home Price Gains According to the S&P/Case-Shiller Home Price Indices
Data through June 2014, released today by S&P Dow Jones Indices for its S&P/Case-Shiller1 Home Price Indices ... show a sustained slowdown in price increases. The National Index gained 6.2% in the 12 months ending June 2014 while the 10-City and 20-City Composites gained 8.1%; all three indices saw their rates slow considerably from last month. Every city saw its year-over-year return worsen.
The National Index, now being published monthly, gained 0.9% in June. The 10- and 20-City Composites increased 1.0%. New York led the cities with a return of 1.6% and recorded its largest increase since June 2013. Chicago, Detroit and Las Vegas followed at +1.4%. Las Vegas posted its largest monthly gain since last summer. ...
“Home price gains continue to ease as they have since last fall,” says David M. Blitzer, Chairman of the Index Committee at S&P Dow Jones Indices. “For the first time since February 2008, all cities showed lower annual rates than the previous month."
 Click on graph for larger image.
 The first graph shows the nominal seasonally adjusted Composite 10 and Composite 20 indices (the Composite 20 was started in January 2000).
The Composite 10 index is off 18.2% from the peak, and down 0.1% in June (SA). The Composite 10 is up 23.8% from the post bubble low set in Jan 2012 (SA).
The Composite 20 index is off 17.4% from the peak, and down 0.2% (SA) in June. The Composite 20 is up 24.5% from the post-bubble low set in Jan 2012 (SA).
 The second graph shows the Year over year change in both indices.
The Composite 10 SA is up 8.1% compared to June 2013.
The Composite 20 SA is up 8.1% compared to June 2013.
Prices increased (SA) in 7 of the 20 Case-Shiller cities in June seasonally adjusted. (Prices increased in 20 of the 20 cities NSA) Prices in Las Vegas are off 42.7% from the peak, and prices in Denver and Dallas are at new highs (SA).
This was lower than the consensus forecast for a 8.4% YoY increase and suggests a further slowdown in price increases. I'll have more on house prices later.


