by Calculated Risk on 7/29/2014 11:59:00 PM
Tuesday, July 29, 2014
Wednesday: Q2 GDP, FOMC Statement, ADP Employment
First, for a very interesting discussion on GDP and seasonality see: GDP: Seasons and revisions . Too bad the BEA doesn't release NSA data any more - but the graph is interesting.
And the Atlanta Fed released their final GDPNow for Q2:
The final GDPNow model forecast for real GDP growth (seasonally adjusted annual rate) in the second quarter of 2014 was 2.7 percent on July 25, unchanged from its July 17 reading. The first GDPNow model forecast for GDP growth in the third quarter will be released August 1.Wednesday:
• At 7:00 AM ET, the Mortgage Bankers Association (MBA) will release the results for the mortgage purchase applications index.
• At 8:15 AM, the ADP Employment Report for July. This report is for private payrolls only (no government). The consensus is for 235,000 payroll jobs added in July, down from 280,000 in June.
• At 8:30 AM, Gross Domestic Product, 2nd quarter 2014 (advance estimate); Includes historical revisions from the BEA. The consensus is that real GDP increased 2.9% annualized in Q2.
• At 2:00 PM, the FOMC Statement. No change in interest rates is expected (for a long time). However the FOMC is expected to reduce QE3 asset purchases by $10 billion per month at this meeting.
Zillow: Case-Shiller House Price Index expected to slow further year-over-year in June
by Calculated Risk on 7/29/2014 09:00:00 PM
The Case-Shiller house price indexes for May were released this morning. Zillow has started forecasting Case-Shiller a month early - and I like to check the Zillow forecasts since they have been pretty close.
From Zillow: Case-Shiller Forecast: Expecting Further Slowdowns Ahead
The Case-Shiller data for May 2014 came out this morning, and based on this information and the June 2014 Zillow Home Value Index (ZHVI, released July 20th), we predict that next month’s Case-Shiller data (June 2014) will show that both the non-seasonally adjusted (NSA) 20-City Composite Home Price Index and the NSA 10-City Composite Home Price Index increased by 8.1 percent on a year-over-year basis. The seasonally adjusted (SA) month-over-month change from May to June will be flat for the 20-City Composite Index and 0.1 percent for the 10-City Composite Home Price Index (SA). All forecasts are shown in the table below. Officially, the Case-Shiller Composite Home Price Indices for June will not be released until Tuesday, August 26.So the Case-Shiller index will probably show a lower year-over-year gain in June than in May (9.3% year-over-year).
| Zillow June 2014 Forecast for Case-Shiller Index | |||||
|---|---|---|---|---|---|
| Case Shiller Composite 10 | Case Shiller Composite 20 | ||||
| NSA | SA | NSA | SA | ||
| Case Shiller (year ago) | June 2013 | 173.17 | 171.70 | 159.46 | 157.92 |
| Case-Shiller (last month) | May 2014 | 185.33 | 185.79 | 170.64 | 171.04 |
| Zillow Forecast | YoY | 8.1% | 8.1% | 8.1% | 8.1% |
| MoM | 1.0% | 0.1% | 1.0% | 0.0% | |
| Zillow Forecasts1 | 187.2 | 185.8 | 172.4 | 171.0 | |
| Current Post Bubble Low | 146.45 | 149.87 | 134.07 | 137.13 | |
| Date of Post Bubble Low | Mar-12 | Feb-12 | Mar-12 | Jan-12 | |
| Above Post Bubble Low | 27.8% | 24.0% | 28.6% | 24.6% | |
| 1Estimate based on Year-over-year and Month-over-month Zillow forecasts | |||||
A few comments on the Seasonal Pattern for House Prices
by Calculated Risk on 7/29/2014 01:46:00 PM
There has always been a clear seasonal pattern for house prices, but the seasonal differences have been more pronounced since the housing bust.
Even in normal times house prices tend to be stronger in the spring and early summer than in the fall and winter. Recently there has been a larger than normal seasonal pattern mostly because conventional sales are following the normal pattern (more sales in the spring and summer), but distressed sales (foreclosures and short sales) happen all year. So distressed sales have had a larger negative impact on prices in the fall and winter.
Note: I was one of several people to question the change in the seasonal factor (here is a post in 2009) - and this led to S&P Case-Shiller questioning the seasonal factor too (from April 2010).
 Click on graph for larger image.
This graph shows the month-to-month change in the CoreLogic and NSA Case-Shiller Composite 20 index since 2001 (both through May). The seasonal pattern was smaller back in the early '00s, and increased since the bubble burst.
It appears we've already seen the strongest month this year (NSA) for both Case-Shiller NSA and CoreLogic. This suggests both indexes will turn negative seasonally (NSA) earlier this year than the previous two years - perhaps in the August reports.
 The second graph shows the seasonal factors for the Case-Shiller composite 20 index. The factors started to change near the peak of the bubble, and really increased during the bust.
It appears the seasonal factor has started to decrease, and I expect that over the next several years - as the percent of distressed sales declines further and recent history is included in the factors - the seasonal factors will move back towards more normal levels.
House Prices: Real Prices and Price-to-Rent Ratio decline in May
by Calculated Risk on 7/29/2014 11:52:00 AM
I've been expecting a slowdown in year-over-year prices as "For Sale" inventory increases, and the slowdown is here! The Case-Shiller Composite 20 index was up 9.3% year-over-year in May; the smallest year-over-year increase since January 2013.
This is still a very strong year-over-year change, but on a seasonally adjusted monthly basis, the Case-Shiller Composite 20 index was down 0.3% in May. This was the first monthly decrease since prices bottomed in early 2012. (Note: The seasonal factor is skewed by foreclosures).
On a real basis (inflation adjusted), prices actually declined for the second consecutive month. The price-rent ratio also declined in May for the Case-Shiller Composite 20 index.
It is important to look at prices in real terms (inflation adjusted). Case-Shiller, CoreLogic and others report nominal house prices. As an example, if a house price was $200,000 in January 2000, the price would be close to $280,000 today adjusted for inflation (40%). That is why the second graph below is important - this shows "real" prices (adjusted for inflation).
Nominal House Prices
 The first graph shows the quarterly Case-Shiller National Index SA (through Q1 2014), and the monthly Case-Shiller Composite 20 SA and CoreLogic House Price Indexes (through May) in nominal terms as reported.
In nominal terms, the Case-Shiller National index (SA) is back to mid-2004 levels (and also back up to Q2 2008), and the Case-Shiller Composite 20 Index (SA) is back to October 2004 levels, and the CoreLogic index (NSA) is back to January 2005.
Real House Prices
 The second graph shows the same three indexes in real terms (adjusted for inflation using CPI less Shelter). Note: some people use other inflation measures to adjust for real prices.
In real terms, the National index is back to Q4 2001 levels, the Composite 20 index is back to July 2002, and the CoreLogic index back to January 2003.
In real terms, house prices are back to early '00s levels.
Price-to-Rent
In October 2004, Fed economist John Krainer and researcher Chishen Wei wrote a Fed letter on price to rent ratios: House Prices and Fundamental Value. Kainer and Wei presented a price-to-rent ratio using the OFHEO house price index and the Owners' Equivalent Rent (OER) from the BLS.
 Here is a similar graph using the Case-Shiller National, Composite 20 and CoreLogic House Price Indexes.
This graph shows the price to rent ratio (January 1998 = 1.0).
On a price-to-rent basis, the Case-Shiller National index is back to Q1 2002 levels, the Composite 20 index is back to November 2002 levels, and the CoreLogic index is back to May 2003.
In real terms, and as a price-to-rent ratio, prices are mostly back to early 2000 levels. And real prices (and the price-to-rent ratio) have declined for two consecutive months using Case-Shiller Comp 20.
HVS: Q2 2014 Homeownership and Vacancy Rates
by Calculated Risk on 7/29/2014 10:15:00 AM
The Census Bureau released the Housing Vacancies and Homeownership report for Q2 2014 this morning.
This report is frequently mentioned by analysts and the media to track the homeownership rate, and the homeowner and rental vacancy rates. However, there are serious questions about the accuracy of this survey.
This survey might show the trend, but I wouldn't rely on the absolute numbers. The Census Bureau is investigating the differences between the HVS, ACS and decennial Census, and analysts probably shouldn't use the HVS to estimate the excess vacant supply or household formation, or rely on the homeownership rate, except as a guide to the trend.
 Click on graph for larger image.
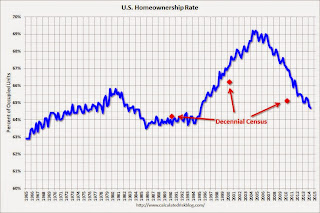
The Red dots are the decennial Census homeownership rates for April 1st 1990, 2000 and 2010. The HVS homeownership rate decreased to 64.7% in Q2, from 64.8% in Q1.
I'd put more weight on the decennial Census numbers - and given changing demographics, the homeownership rate is probably close to a bottom.
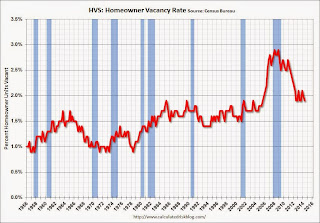
 The HVS homeowner vacancy decreased to 1.9% in Q2.
It isn't really clear what this means. Are these homes becoming rentals?
Once again - this probably shows that the general trend is down, but I wouldn't rely on the absolute numbers.
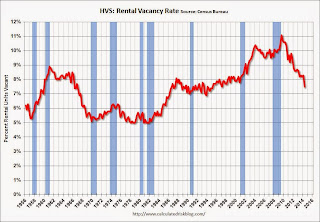
 The rental vacancy rate decreased in Q2 to 7.5% from 8.3% in Q1.
I think the Reis quarterly survey (large apartment owners only in selected cities) is a much better measure of the rental vacancy rate - and Reis reported that the rental vacancy rate is at the lowest level since 2001 - and might be close to a bottom.
The quarterly HVS is the most timely survey on households, but there are many questions about the accuracy of this survey. Unfortunately many analysts still use this survey to estimate the excess vacant supply.


