by Calculated Risk on 5/01/2014 03:14:00 PM
Thursday, May 01, 2014
U.S. Light Vehicle Sales decrease to 16.0 million annual rate in April
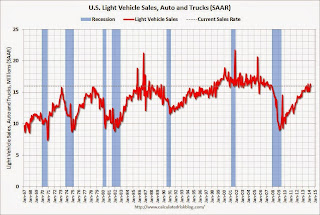
Based on an AutoData estimate, light vehicle sales were at a 16.04 million SAAR in April. That is up 5.5% from April 2013, and down 2% from the sales rate last month.
This was below the consensus forecast of 16.2 million SAAR (seasonally adjusted annual rate).
 Click on graph for larger image.
This graph shows the historical light vehicle sales from the BEA (blue) and an estimate for April (red, light vehicle sales of 16.04 million SAAR from AutoData).
Severe weather clearly impacted sales in January and February, and some of the increase in March was probably a bounce back due to better weather. Sales in April were probably a return to trend.
The second graph shows light vehicle sales since the BEA started keeping data in 1967.
 Note: dashed line is current estimated sales rate.
Unlike residential investment, auto sales bounced back fairly quickly following the recession and were a key driver of the recovery.
Looking forward, the growth rate will slow for auto sales, and most forecasts are for around a small gain in 2014 to around 16.1 million light vehicles.
Lawler: Large home builders net orders last quarter "vitually flat" from year ago
by Calculated Risk on 5/01/2014 12:17:00 PM
M.D.C. Holdings reported that net home orders in the quarter ended March 31, 2014 totaled 1,236, down 4.9% from the comparable quarter of 2013. Net orders per active community were down 9.6% from a year ago. The company’s sales cancellation rate, expressed as a % of gross orders, was 19% last quarter, up slightly from 18% a year earlier. Home deliveries last quarter totaled 873, down 14.2% from the comparable quarter of 2013, at an average sale price of $377,000, up 11.1% from a year ago. The company’s order backlog at the end of March was 1,625, down 15.7% from last March. M.D.C. owned or controlled 16,043 lots at the end of March, up 25.9% from a year ago, and the company’s active community count at the end of March was 157, up 13% from last March.
M.D.C. attributed the increase in its average sales price both to price appreciation in “many” of its markets and to a shift in the mix of homes closed. The biggest YOY declines in net orders per active community were in Nevada, Virginia, Maryland, and Arizona.
Beazer Homes reported that net home orders in the quarter ended March 31, 2014 totaled 1,390, down 8.6% from the comparable quarter of 2013. Beazer’s net orders per community last quarter were down 2.9% from a year earlier. The company’s sales cancellation rate, expressed as a % of gross orders, was 19.4% last quarter, up slightly from 18.7% a year ago. Home deliveries totaled 977 last quarter, down 13.3% from the comparable quarter of 2013, at an average sales price of $272,400, up 7.5% from a year ago. The company’s order backlog at the end of March was 2,163, down 2.2% from last March. Beazer owned or controlled 29,331 lots at the end of March, up 18.8% from last March.
Below are some summary stats for 8 large publicly-traded home builders.
As the table indicates, net orders at these eight builders combined last quarter were virtually flat from the comparable quarter of last year. While not all of these builders released active community count numbers, based on conference call comments I estimate that net orders per community for the eight builders as a whole last quarter were down about 6% from a year ago.
| Net Orders | Settlements | Average Closing Price | |||||||
|---|---|---|---|---|---|---|---|---|---|
| Qtr. Ended: | 3/14 | 3/13 | % Chg | 3/14 | 3/13 | % Chg | 3/14 | 3/13 | % Chg |
| D.R. Horton | 8,569 | 7,879 | 8.8% | 6,194 | 5,463 | 13.4% | $271,230 | $242,548 | 11.8% |
| Pulte Group | 4,863 | 5,200 | -6.5% | 3,436 | 3,833 | -10.4% | $317,000 | $287,000 | 10.5% |
| NVR | 3,325 | 3,510 | -5.3% | 2,211 | 2,272 | -2.7% | $361,400 | $330,400 | 9.4% |
| The Ryland Group | 2,186 | 2,052 | 6.5% | 1,470 | 1,315 | 11.8% | $327,000 | $277,000 | 18.1% |
| Meritage Homes | 1,525 | 1,547 | -1.4% | 1,109 | 1,052 | 5.4% | $365,896 | $314,363 | 16.4% |
| M/I Homes | 982 | 1,047 | -6.2% | 737 | 627 | 17.5% | $299,000 | $284,000 | 5.3% |
| Total | 21,450 | 21,235 | 1.0% | 15,157 | 14,562 | 4.1% | $308,445 | $278,040 | 10.9% |
Construction Spending increased 0.2% in March, Public Construction Spending Lowest since 2006
by Calculated Risk on 5/01/2014 10:29:00 AM
The Census Bureau reported that overall construction spending increased in March:
The U.S. Census Bureau of the Department of Commerce announced today that construction spending during March 2014 was estimated at a seasonally adjusted annual rate of $942.5 billion, 0.2 percent above the revised February estimate of $940.8 billion. The March figure is 8.4 percent above the March 2013 estimate of $869.2 billion.Private spending increased and public spending decreased in March:
Spending on private construction was at a seasonally adjusted annual rate of $679.6 billion, 0.5 percent above the revised February estimate of $676.3 billion. ...
In March, the estimated seasonally adjusted annual rate of public construction spending was $262.9 billion, 0.6 percent below the revised February estimate of $264.5 billion.
emphasis added
 Click on graph for larger image.
This graph shows private residential and nonresidential construction spending, and public spending, since 1993. Note: nominal dollars, not inflation adjusted.
Private residential spending is 45% below the peak in early 2006, and up 62% from the post-bubble low.
Non-residential spending is 25% below the peak in January 2008, and up about 38% from the recent low.
Public construction spending is now 19% below the peak in March 2009 and at a new post-recession low.
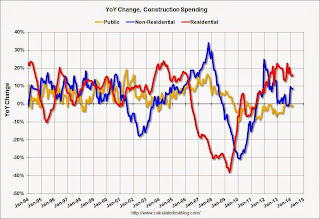
 The second graph shows the year-over-year change in construction spending.
On a year-over-year basis, private residential construction spending is now up 16%. Non-residential spending is up 8 year-over-year. Public spending is down 1% year-over-year.
Looking forward, all categories of construction spending should increase in 2014. Residential spending is still very low, non-residential is starting to pickup, and public spending is probably near a bottom.
Note: Public construction spending is at the lowest level since 2006 (lowest since 2001 adjusted for inflation). Not investing more in infrastructure is probably one of the major policy failures of the last 5+ years.
ISM Manufacturing index increased in April to 54.9
by Calculated Risk on 5/01/2014 10:00:00 AM
The ISM manufacturing index suggests faster expansion in April than in March. The PMI was at 54.9% in April, up from 53.7% in March. The employment index was at 54.7%, up from 51.1% in March, and the new orders index was at 55.1%, unchanged from 55.1% in March.
From the Institute for Supply Management: April 2014 Manufacturing ISM Report On Business®
Economic activity in the manufacturing sector expanded in April for the 11th consecutive month, and the overall economy grew for the 59th consecutive month, say the nation's supply executives in the latest Manufacturing ISM® Report On Business®.
The report was issued today by Bradley J. Holcomb, CPSM, CPSD, chair of the Institute for Supply Management® (ISM®) Manufacturing Business Survey Committee. "The April PMI® registered 54.9 percent, an increase of 1.2 percentage points from March's reading of 53.7 percent, indicating expansion in manufacturing for the 11th consecutive month. The New Orders Index registered 55.1 percent, equal to the reading in March, indicating growth in new orders for the 11th consecutive month. The Production Index registered 55.7 percent, slightly below the March reading of 55.9 percent. Employment grew for the 10th consecutive month, registering 54.7 percent, an increase of 3.6 percentage points over March's reading of 51.1 percent. Comments from the panel generally remain positive; however, some expressed concern about international economic and political issues potentially impacting demand."
emphasis added
 Click on graph for larger image.
Here is a long term graph of the ISM manufacturing index.
This was above expectations of 54.2%.
Weekly Initial Unemployment Claims increase to 344,000
by Calculated Risk on 5/01/2014 08:34:00 AM
The DOL reports:
In the week ending April 26, the advance figure for seasonally adjusted initial claims was 344,000, an increase of 14,000 from the previous week's revised level. The previous week's level was revised up by 1,000 from 329,000 to 330,000. The 4-week moving average was 320,000, an increase of 3,000 from the previous week's revised average. The previous week's average was revised up by 250 from 316,750 to 317,000.The previous week was revised up from 329,000.
There were no special factors impacting this week's initial claims.
The following graph shows the 4-week moving average of weekly claims since January 2000.
 Click on graph for larger image.
The dashed line on the graph is the current 4-week average. The four-week average of weekly unemployment claims increased to 320,000.
This was above the consensus forecast of 320,000. Even with the increase, the 4-week average is close to normal levels for an expansion.


