by Calculated Risk on 4/21/2014 11:22:00 AM
Monday, April 21, 2014
Report: Property Tax Collections above Pre-Recession Peak
From Bloomberg: Property-Tax Collections Rising at Fastest Pace Since U.S. Crash
Property-tax collections nationally rose to $182.8 billion during the last three months of 2013 ... according to a U.S. Census estimate last month. That topped the previous peak four years earlier ...
In cities including San Jose, California, Nashville, Tennessee, Houston and Washington, revenue from real-estate levies has set records, or is poised to.
Local governments are using the money to hire police, increase salaries and pave roads after the decline in property values and 18-month recession that ended in 2009 forced them to eliminate about 600,000 workers ...
 Click on graph for larger image.
Here is the report from the Census Bureau: Quarterly Summary of State and Local Government Tax Revenue for 2013:Q4
This graph from the Census Bureau report shows Q4 property taxes since 2003 - and property taxes have increased slightly in Q4 2013 and are back to the pre-recession peak.
This another data point suggesting that aggregate layoffs are over at the state and local level.
DOT: Vehicle Miles Driven decreased 0.8% year-over-year in February
by Calculated Risk on 4/21/2014 09:50:00 AM
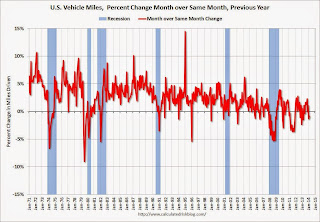
Some of this monthly decline appears weather related since miles driven were down 3.0% in the Northeast. Miles driven were up 0.4% in the West.
The Department of Transportation (DOT) reported:
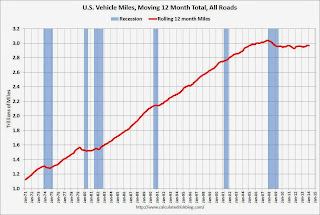
Travel on all roads and streets changed by -0.8% (-1.7 billion vehicle miles) for February 2014 as compared with February 2013.The following graph shows the rolling 12 month total vehicle miles driven.
...
Travel for the month is estimated to be 212.8 billion vehicle miles.
The rolling 12 month total is still mostly moving sideways but has started to increase a little recently.
 Click on graph for larger image.
In the early '80s, miles driven (rolling 12 months) stayed below the previous peak for 39 months.
Currently miles driven has been below the previous peak for 75 months - 6+ years - and still counting. Currently miles driven (rolling 12 months) are about 2.3% below the previous peak.
The second graph shows the year-over-year change from the same month in the previous year.
 In February 2014, gasoline averaged of $3.43 per gallon according to the EIA. that was down from February 2013 when prices averaged $3.73 per gallon.
As we've discussed, gasoline prices are just part of the story. The lack of growth in miles driven over the last 6 years is probably also due to the lingering effects of the great recession (high unemployment rate and lack of wage growth), the aging of the overall population (over 55 drivers drive fewer miles) and changing driving habits of young drivers.
With all these factors, it might take a few more years before we see a new peak in miles driven.
Sunday, April 20, 2014
Sunday Night Futures
by Calculated Risk on 4/20/2014 08:39:00 PM
An article from Tim Logan at the LA Times on a subject I've discussed with several people via email: Student debt holds back many would-be home buyers
Of the many factors holding back young home buyers — rising prices, tougher lending standards, a still-shaky job market — none looms larger than the recent explosion of college debt.Monday:
The amount owed on student loans has tripled in a decade, to nearly $1.1 trillion, according to the Federal Reserve Bank of New York. People in their 20s and 30s — often the best-educated and highest-earning among them — owe most of that tab. That is keeping a crucial segment of home buyers on the sidelines, deferring one of the traditional markers of adult success.
• At 8:30 AM ET, the Chicago Fed National Activity Index for March. This is a composite index of other data.
Weekend:
• Schedule for Week of April 20th
From CNBC: Pre-Market Data and Bloomberg futures: the S&P futures are up 3 and DOW futures are up 35 (fair value).
Oil prices are up recently with WTI futures at $104.25 per barrel and Brent at $109.53 per barrel.
Below is a graph from Gasbuddy.com for nationwide gasoline prices. Nationally prices are around $3.63 per gallon (up sharply over the last ten weeks and more than 10 cents above the level of a year ago). If you click on "show crude oil prices", the graph displays oil prices for WTI, not Brent; gasoline prices in most of the U.S. are impacted more by Brent prices.
| Orange County Historical Gas Price Charts Provided by GasBuddy.com |
WSJ: Slight Easing of Mortgage Credit Standards
by Calculated Risk on 4/20/2014 10:51:00 AM
From Nick Timiraos and AnnaMaria Andriotis at the WSJ: Mortgage Lenders Ease Rules for Home Buyers in Hunt for Business
While standards remain tight by historical measures, lenders have started to accept lower credit scores and to reduce down-payment requirements.No one wants a return to the loose lending standards of the mid-00s - and I hope we never see another Alt-A loan - but I expect standards to loosen over the next few years.
...
Another sign that banks could get less picky: Credit scores for borrowers seeking conventional mortgages also are easing. Scores on purchase mortgages stood at 755 in March, down from 761 a year earlier, according to data from Ellie Mae, a mortgage-software provider. Those on purchase loans backed by the FHA dropped to 684, compared with 696 one year earlier. ...
Smaller lenders are accepting even lower scores. Average credit scores on purchase loans closed through a consortium called LendingTree fell to 679 in March, down from the year-earlier 715.
...
"Tiny fractions of borrowers can do things that they could not a year ago," said Lou Barnes, a mortgage banker in Boulder, Colo.
Saturday, April 19, 2014
Unofficial Problem Bank list declines to 521 Institutions
by Calculated Risk on 4/19/2014 01:25:00 PM
This is an unofficial list of Problem Banks compiled only from public sources.
Here is the unofficial problem bank list for April 18, 2014.
Changes and comments from surferdude808:
An expected update from the OCC on its recent enforcement action activity contributed to a noticeable reduction in the Unofficial Problem Bank List this week. After nine removals, the list stands at 521 institutions with assets of $168.9 billion. A year ago, the list held 781 institutions with assets of $288.5 billion.
Finding their way off the list through merger were National Bank of Earlville, Earlville, IL ($57 million) and Liberty Savings Bank, F.S.B., Pottsville, PA ($23 million). Actions were terminated against Eastern Savings Bank, FSB, Hunt Valley, MD ($425 million); Phoenixville Federal Bank and Trust, Phoenixville, PA ($388 million); First Federal Savings Bank, Ottawa, IL ($380 million); Southwestern National Bank, Houston, TX ($348 million); Columbia Community Bank, Hillsboro, OR ($335 million Ticker: CLBC); Pacific Global Bank, Chicago, IL ($155 million); The First National Bank of Hartford, Hartford, AL ($120 million); and Central Federal Savings and Loan Association of Chicago, Chicago, IL ($95 million).
Next Friday we anticipate an update from the FDIC on its recent enforcement action activity.


