by Calculated Risk on 4/17/2014 05:59:00 PM
Thursday, April 17, 2014
LA area Port Traffic: Up year-over-year in March, Exports at New High
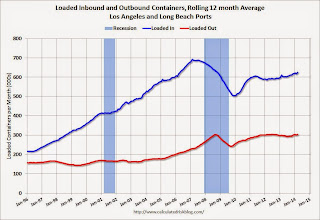
Container traffic gives us an idea about the volume of goods being exported and imported - and possibly some hints about the trade report for March since LA area ports handle about 40% of the nation's container port traffic.
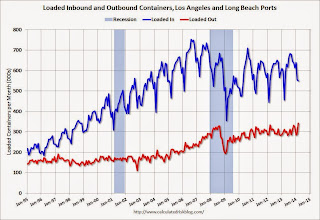
The following graphs are for inbound and outbound traffic at the ports of Los Angeles and Long Beach in TEUs (TEUs: 20-foot equivalent units or 20-foot-long cargo container).
To remove the strong seasonal component for inbound traffic, the first graph shows the rolling 12 month average.
 Click on graph for larger image.
On a rolling 12 month basis, inbound traffic was up 1.3% compared to the rolling 12 months ending in February. Outbound traffic was up 0.9% compared to 12 months ending in February.
Inbound traffic has generally been increasing, and outbound traffic has been moving up a little after moving sideways.
The 2nd graph is the monthly data (with a strong seasonal pattern for imports).
 Usually imports peak in the July to October period as retailers import goods for the Christmas holiday, and then decline sharply and bottom in February or March (depending on the timing of the Chinese New Year).
This suggests an increase in trade with Asia in March.
Hotels: Strongest Year since 2000
by Calculated Risk on 4/17/2014 01:12:00 PM
From HotelNewsNow.com: US hotels report strong weekly RevPAR
The U.S. hotel industry posted positive results in the three key performance measurements during the week of 6-12 April 2014, according to data from STR.Note: ADR: Average Daily Rate, RevPAR: Revenue per Available Room. These metrics are now at new highs.
In year-over-year measurements, the industry’s revenue per available room jumped 12.8% to $80.09. Occupancy for the week increased 7.1% to 68.5%. Average daily rate rose 5.3% to finish the week at $116.85.
emphasis added
The 4-week average of the occupancy rate is solidly above the median for 2000-2007, and is at the highest level since 2000.
The following graph shows the seasonal pattern for the hotel occupancy rate using the four week average.
 Click on graph for larger image.
The red line is for 2014 and black is for 2009 - the worst year since the Great Depression for hotels.
Through April 12th, the 4-week average of the occupancy rate is tracking higher than pre-recession levels.
It looks like 2014 should be a good year for hotels.
Data Source: Smith Travel Research, Courtesy of HotelNewsNow.com
Philly Fed Manufacturing Survey indicated Faster Expansion in April
by Calculated Risk on 4/17/2014 10:29:00 AM
From the Philly Fed: April Manufacturing Survey
Manufacturing activity in the region increased in April, according to firms responding to this month’s Business Outlook Survey. The survey’s broadest indicators for general activity, new orders, shipments, and employment all remained positive and increased from their readings in March. Price pressures remain modest. The surveyʹs indicators of future activity reflected optimism about continued expansion over the next six months, although the indicators have fallen from higher readings in recent months.This was above the consensus forecast of a reading of 9.1 for April.
The survey’s broadest measure of manufacturing conditions, the diffusion index of current activity, increased from a reading of 9.0 in March to 16.6 this month, its highest reading since last September.
The employment index remained positive for the 10th consecutive month and increased 5 points, suggesting overall improvement.
emphasis added
Weekly Initial Unemployment Claims at 304,000; 4-Week average lowest since 2007
by Calculated Risk on 4/17/2014 08:37:00 AM
The DOL reports:
In the week ending April 12, the advance figure for seasonally adjusted initial claims was 304,000, an increase of 2,000 from the previous week's revised level. The previous week's level was revised up by 2,000 from 300,000 to 302,000. The 4-week moving average was 312,000, a decrease of 4,750 from the previous week's revised average. This is the lowest level for this average since October 6, 2007 when it was 302,000.The previous week was revised up from 300,000.
The following graph shows the 4-week moving average of weekly claims since January 2000.
 Click on graph for larger image.
The dashed line on the graph is the current 4-week average. The four-week average of weekly unemployment claims decreased to 312,000.
This was lower than the consensus forecast of 320,000. The 4-week average is at normal levels for an expansion.
Wednesday, April 16, 2014
Thursday: Unemployment Claims, Philly Fed Mfg Survey
by Calculated Risk on 4/16/2014 08:55:00 PM
Some more data from DataQuick: California March Home Sales
An estimated 32,923 new and resale houses and condos sold statewide in March. That was up 28.2 percent from 25,680 in February, and down 12.8 percent from 37,764 sales in March 2013, according to San Diego-based DataQuick.A common theme now: As distress sales decline, overall sales decline too.
Last month’s sales were the lowest for a March since 2008, when 24,565 homes sold – a record low for the month of March. California’s high for March sales was 68,848 in 2005. Last month's sales were 23.9 percent below the average of 43,251 sales for all months of March since 1988, when DataQuick's statistics begin. California sales haven’t been above average for any particular month in more than eight years.
...
Of the existing homes sold last month, 7.4 percent were properties that had been foreclosed on during the past year. That was down from a revised 8.0 percent in February and down from 15.0 percent a year earlier. California’s foreclosure resales peaked at 58.8 percent in February 2009.
Short sales - transactions where the sale price fell short of what was owed on the property - made up an estimated 7.4 percent of the homes that resold last month. That was down from an estimated 9.3 percent the month before and 18.7 percent a year earlier.
Thursday:
• At 8:30 AM ET, the initial weekly unemployment claims report will be released. The consensus is for claims to increase to 320 thousand from 300 thousand.
• At 10:00 AM, the Philly Fed manufacturing survey for April. The consensus is for a reading of 9.1, up from 9.0 last month (above zero indicates expansion).


