by Calculated Risk on 4/14/2014 05:42:00 PM
Monday, April 14, 2014
Sacramento Housing in March: Total Sales down 12% Year-over-year, Equity (Conventional) Sales up 16%, Active Inventory increases 71%
Several years ago I started following the Sacramento market to look for changes in the mix of houses sold (conventional, REOs, and short sales). For a long time, not much changed. But over the last 2+ years we've seen some significant changes with a dramatic shift from foreclosures (REO: lender Real Estate Owned) to short sales, and the percentage of total distressed sales declining sharply.
This data suggests healing in the Sacramento market, although some of this is due to investor buying. Other distressed markets are showing similar improvement. Note: The Sacramento Association of REALTORS® started breaking out REOs in May 2008, and short sales in June 2009.
In March 2014, 16.3% of all resales (single family homes) were distressed sales. This was down from 19.1% last month, and down from 37.5% in March 2013.
The percentage of REOs was at 7.8%, and the percentage of short sales was 8.5%.
Here are the statistics.
 Click on graph for larger image.
This graph shows the percent of REO sales, short sales and conventional sales.
There has been a sharp increase in conventional sales over the last 2 years (blue).
Active Listing Inventory for single family homes increased 71.2% year-over-year in February.
Cash buyers accounted for 22.5% of all sales, down from 36.4% in March 2013, and down from 26.5% last month (frequently investors). This has been trending down, and it appears investors are becoming less of a factor in Sacramento.
Total sales were down 12.4% from March 2013, but conventional sales were up 16.4% compared to the same month last year. This is exactly what we expect to see in an improving distressed market - flat or even declining overall sales as distressed sales decline, and conventional sales increasing.
As I've noted before, we are seeing a similar pattern in other distressed areas.
Weekly Update: Housing Tracker Existing Home Inventory up 7.8% year-over-year on April 14th
by Calculated Risk on 4/14/2014 03:33:00 PM
Here is another weekly update on housing inventory ...
There is a clear seasonal pattern for inventory, with the low point for inventory in late December or early January, and then usually peaking in mid-to-late summer.
The Realtor (NAR) data is monthly and released with a lag (the most recent data was for February). However Ben at Housing Tracker (Department of Numbers) has provided me some weekly inventory data for the last several years.
 Click on graph for larger image.
This graph shows the Housing Tracker reported weekly inventory for the 54 metro areas for 2010, 2011, 2012, 2013 and 2014.
In 2011 and 2012, inventory only increased slightly early in the year and then declined significantly through the end of each year.
In 2013 (Blue), inventory increased for most of the year before declining seasonally during the holidays. Inventory in 2013 finished up 2.7% YoY.
Inventory in 2014 (Red) is now 7.8% above the same week in 2013.
Inventory is still very low, but this increase in inventory should slow house price increases.
Note: One of the key questions for 2014 will be: How much will inventory increase? My guess is inventory will be up 10% to 15% year-over-year by the end of 2014 (inventory would still be below normal).
CBO Projection: Budget Deficit to be Smaller than Previous Forecast
by Calculated Risk on 4/14/2014 11:00:00 AM
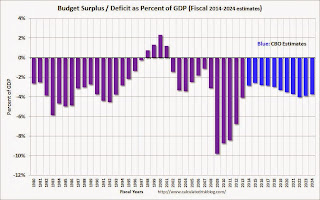
The Congressional Budget Office (CBO) released their new Updated Budget Projections: 2014 to 2024. The projected budget deficits have been reduced for each of the next ten years, and the projected deficit for 2014 has been revised down from 3.0% to 2.8%.
From the CBO:
As it usually does each spring, CBO has updated the baseline budget projections that it released earlier in the year. CBO now estimates that if the current laws that govern federal taxes and spending do not change, the budget deficit in fiscal year 2014 will be $492 billion. Relative to the size of the economy, that deficit—at 2.8 percent of gross domestic product (GDP)—will be nearly a third less than the $680 billion shortfall in fiscal year 2013, which was equal to 4.1 percent of GDP. This will be the fifth consecutive year in which the deficit has declined as a share of GDP since peaking at 9.8 percent in 2009.The CBO projects the deficit will decline further in 2015, and be below 3% of GDP through fiscal 2018. Then the deficit will slowly increase.
...
CBO’s estimate of the deficit for this year is $23 billion less than its February estimate, mostly because the agency now anticipates lower outlays for discretionary programs and net interest payments. The projected cumulative deficit from 2015 through 2024 is $286 billion less than it was in February.
...
But if current laws do not change, the period of shrinking deficits will soon come to an end. Between 2015 and 2024, annual budget shortfalls are projected to rise substantially—from a low of $469 billion in 2015 to about $1 trillion from 2022 through 2024—mainly because of the aging population, rising health care costs, an expansion of federal subsidies for health insurance, and growing interest payments on federal debt.
emphasis added
 Click on graph for larger image.
This graph shows the actual (purple) budget deficit each year as a percent of GDP, and an estimate for the next ten years based on estimates from the CBO.
After 2015, the deficit will start to increase again according to the CBO.
Retail Sales increased 1.1% in March
by Calculated Risk on 4/14/2014 08:48:00 AM
On a monthly basis, retail sales increased 1.1% from February to March (seasonally adjusted), and sales were up 3.8% from March 2013. Sales in February were revised up from a 0.3% increase to a 0.7% increase. From the Census Bureau report:
The U.S. Census Bureau announced today that advance estimates of U.S. retail and food services sales for March, adjusted for seasonal variation and holiday and trading-day differences, but not for price changes, were $433.9 billion, an increase of 1.1 percent from the previous month, and 3.8 percent above March 2013. ... The January 2014 to February 2014 percent change was revised from +0.3 percent to +0.7 percent
 Click on graph for larger image.
This graph shows retail sales since 1992. This is monthly retail sales and food service, seasonally adjusted (total and ex-gasoline).
Retail sales ex-autos increased 0.7%.
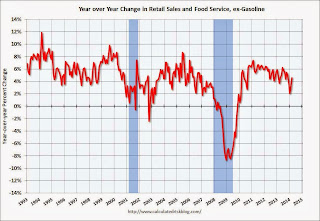
The second graph shows the year-over-year change in retail sales and food service (ex-gasoline) since 1993.
 Retail sales ex-gasoline increased by 4.6% on a YoY basis (3.8% for all retail sales).
The increase in March was above consensus expectations and this was a strong report.
Sunday, April 13, 2014
Monday: Retail Sales, CBO Budget Projections
by Calculated Risk on 4/13/2014 08:38:00 PM
Monday:
• At 8:30 AM ET, Retail sales for March will be released. The consensus is for retail sales to increase 0.8% in March, and to increase 0.4% ex-autos.
• At 10:00 AM, Manufacturing and Trade: Inventories and Sales (business inventories) report for February. The consensus is for a 0.5% increase in inventories.
• At 11:00 AM, CBO will release its updated 10-year baseline projections of federal spending, revenues, and budget deficits.
Weekend:
• Schedule for Week of April 13th
• Q1 Review: Ten Economic Questions for 2014
From CNBC: Pre-Market Data and Bloomberg futures: the S&P futures and DOW futures are mostly unchanged (fair value).
Oil prices are up with WTI futures at $104.05 per barrel and Brent at $107.33 per barrel.
Below is a graph from Gasbuddy.com for nationwide gasoline prices. Nationally prices are around $3.60 per gallon, up sharply from earlier this year and more than 5 cents higher than last year at this time. If you click on "show crude oil prices", the graph displays oil prices for WTI, not Brent; gasoline prices in most of the U.S. are impacted more by Brent prices.
| Orange County Historical Gas Price Charts Provided by GasBuddy.com |


