 RSS Feed
 by Calculated Risk on 11/07/2012 07:02:00 AM
Wednesday, November 07, 2012
MBA: Hurricane Sandy Leads to Decrease in Mortgage Applications
From the MBA: Storm Leads to Decrease in Mortgage Applications
The Refinance Index ... decreased 5 percent from the previous week. The Refinance Index has declined for five straight weeks and is at its lowest level since the end of August. The seasonally adjusted Purchase Index decreased 5 percent from one week earlier.Some of this decline in activity was related to Hurricane Sandy.
“Last week’s storm had a significant impact on application volumes on the East Coast,” said Mike Fratantoni, MBA’s Vice President of Research and Economics. “Applications fell more than 60 percent compared to the prior week in New Jersey, almost 50 percent in New York and nearly 40 percent in Connecticut. Other East Coast states also saw declines over the week, while many states in other parts of the country had increases in application volumes.”
The average contract interest rate for 30-year fixed-rate mortgages with conforming loan balances ($417,500 or less) decreased to 3.61 percent from 3.65 percent, with points increasing to 0.45 from 0.39 (including the origination fee) for 80 percent loan-to-value ratio (LTV) loans.
 Click on graph for larger image.
This graph shows the MBA mortgage purchase index. The purchase index has been mostly moving sideways over the last two years.
As Fratantoni noted, some states in the Northeast had a sharp decline in activity: "Applications fell more than 60 percent compared to the prior week in New Jersey, almost 50 percent in New York and nearly 40 percent in Connecticut." Most of those areas will bounce back fairly quickly.
Tuesday, November 06, 2012
Election Day
by Calculated Risk on 11/06/2012 05:09:00 PM
A new post for comments and a few election resources:
The WSJ is free online tonight.
CNBC: National election results
From the WaPo: Coming at 6 p.m. ET: Live election results for each state and county
Times polls close in a few key states:
7 PM ET: Polls close in Virginia.
7:30 PM ET: Polls close in Ohio and North Carolina.
8:00 PM: Polls close in Florida and New Hampshire.
9:00 PM: Polls close in Wisconsin and Colorado.
10:00 PM: Polls close in Nevada and Iowa.
Note: I'll add more resources based on comments ...
UPDATE FROM Nemo:
Intrade
Betfair (Take reciprocals of the back/lay numbers to get probabilities)
Profoundly strange (Betting market manipulation? at Self Evident )
UPDATE 2:
Nate Silver's FiveThirtyEight
Ezra Klein's Wonkblog
Lawler: Table of Short Sales and Foreclosures for Selected Cities in September
by Calculated Risk on 11/06/2012 03:20:00 PM
Economist Tom Lawler sent me this today with this note: "I found a few more realtor reports on distressed sales shares for the third quarter."
Previous comments: A couple of clear patterns have developed:
1) There has been a shift from foreclosures to short sales. Foreclosures are down and short sales are up in most areas. For two cities, Las Vegas and Reno, short sales are now three times foreclosures, although that is related to the new foreclosure rules in Nevada. Both Phoenix and Sacramento had over twice as many short sales as foreclosures. A year ago, there were many more foreclosures than short sales in most areas. Minneapolis is an exception with more foreclosures than short sales.
2) The overall percent of distressed sales (combined foreclosures and short sales) are down year-over-year almost everywhere. Chicago is essentially unchanged from a year ago.
And previously from Lawler:
Note that the distressed sales shares in the below table are based on MLS data, and often based on certain “fields” or comments in the MLS files, and some have questioned the accuracy of the data. Some MLS/associations only report on overall “distressed” sales.
| Short Sales Share | Foreclosure Sales Share | Total "Distressed" Share | ||||
|---|---|---|---|---|---|---|
| 12-Sep | 11-Sep | 12-Sep | 11-Sep | 12-Sep | 11-Sep | |
| Las Vegas | 44.8% | 23.5% | 13.6% | 49.4% | 58.4% | 72.9% |
| Reno | 41.0% | 29.0% | 12.0% | 38.0% | 53.0% | 67.0% |
| Phoenix | 27.0% | 27.0% | 12.9% | 37.1% | 39.9% | 64.1% |
| Sacramento | 35.4% | 26.1% | 15.4% | 37.9% | 50.8% | 64.0% |
| Minneapolis | 10.1% | 13.1% | 25.2% | 32.9% | 35.3% | 46.0% |
| Mid-Atlantic (MRIS) | 12.4% | 12.6% | 9.4% | 14.4% | 21.8% | 27.0% |
| Orlando | 28.0% | 25.6% | 24.0% | 35.9% | 52.0% | 61.5% |
| California (DQ)* | 27.0% | 23.8% | 17.7% | 33.8% | 44.7% | 57.6% |
| California (CAR) | 24.3% | 21.0% | 12.3% | 27.5% | 37.0% | 48.7% |
| Lee County, FL*** | 21.4% | 21.4% | 15.9% | 31.5% | 37.3% | 52.9% |
| Colorado** | 6.5% | 6.1% | 12.3% | 19.8% | 18.7% | 25.8% |
| King Co. WA** | 16.0% | 10.0% | 10.0% | 22.0% | 25.0% | 32.0% |
| Hampton Roads VA | 25.4% | 31.6% | ||||
| Miami-Dade | 47.4% | 59.6% | ||||
| Northeast Florida | 44.7% | 49.0% | ||||
| Chicago | 40.6% | 40.0% | ||||
| Rhode Island | 23.9% | 28.9% | ||||
| Miami-Dade | 47.4% | 59.0% | ||||
| Charlotte | 15.3% | 20.9% | ||||
| Columbus OH** | 25.2% | 30.5% | ||||
| Memphis* | 26.3% | 30.8% | ||||
| Birmingham AL | 26.6% | 31.8% | ||||
| Houston | 16.1% | 19.4% | ||||
| *share of existing home sales, based on property records | ||||||
| **Third Quarter | ||||||
| *** SF only | ||||||
CoreLogic: House Price Index declined seasonally in September, Up 5.0% Year-over-year
by Calculated Risk on 11/06/2012 11:30:00 AM
Notes: This CoreLogic House Price Index report is for September. The recent Case-Shiller index release was for August. Case-Shiller is currently the most followed house price index, however CoreLogic is used by the Federal Reserve and is followed by many analysts. The CoreLogic HPI is a three month weighted average and is not seasonally adjusted (NSA).
From CoreLogic: CoreLogic® September Home Price Index Rises 5 Percent Year-Over-Year
Home prices nationwide, including distressed sales, increased on a year-over-year basis by 5 percent in September 2012 compared to September 2011. This change represents the biggest increase since July 2006 and the seventh consecutive increase in home prices nationally on a year-over-year basis. On a month-over-month basis, including distressed sales, home prices decreased by 0.3 percent in September 2012 compared to August 2012.
...
Excluding distressed sales, home prices nationwide also increased on a year-over-year basis by 5 percent in September 2012 compared to September 2011. On a month-over-month basis excluding distressed sales, home prices increased 0.5 percent in September 2012 compared to August 2012, the seventh consecutive month-over-month increase. Distressed sales include short sales and real estate owned (REO) transactions.
The CoreLogic Pending HPI indicates that October 2012 home prices, including distressed sales, are expected to rise by 5.7 percent on a year-over-year basis from October 2011 and fall by 0.5 percent on a month-over-month basis from September 2012 as sales exhibit a seasonal slowdown going into the winter.
...
“Home price improvement nationally continues to outpace our expectations, growing 5 percent year-over-year in September, the best showing since July 2006,” said Mark Fleming, chief economist for CoreLogic. “While prices on a month-over-month basis are declining, as expected in the housing off-season, most states are exhibiting price increases. Gains are particularly large in former housing bubble states and energy-industry concentrated states."
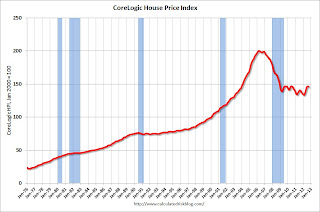 Click on graph for larger image.
 This graph shows the national CoreLogic HPI data since 1976. January 2000 = 100.
The index was down 0.3% in September, and is up 5.0% over the last year.
The index is off 26.9% from the peak - and is up 9.7% from the post-bubble low set in February (the index is NSA, so some of the increase is seasonal).
 The second graph is from CoreLogic. The year-over-year comparison has been positive for seven consecutive months suggesting house prices bottomed earlier this year on a national basis (the bump in 2010 was related to the tax credit).
This is the largest year-over-year increase since 2006.
Since this index is not seasonally adjusted, it was expected to decline on a month-to-month basis in September, and will probably stay negative on a month-to-month basis until the March 2013 report is released. The key for the next several months will be to watch the year-over-year change.
BLS: Job Openings "essentially unchanged" in September, Up year-over-year
by Calculated Risk on 11/06/2012 10:00:00 AM
From the BLS: Job Openings and Labor Turnover Summary
The number of job openings in September was 3.6 million, essentially unchanged from August.The following graph shows job openings (yellow line), hires (dark blue), Layoff, Discharges and other (red column), and Quits (light blue column) from the JOLTS.
...
The level of total nonfarm job openings in September was up from 2.4 million at the end of the recession in June 2009.
...
In September, the quits rate was little changed for total nonfarm, total private, and government. The number of quits was 2.0 million in September compared to 1.8 million at the end of the recession in June 2009.
This series started in December 2000.
Note: The difference between JOLTS hires and separations is similar to the CES (payroll survey) net jobs headline numbers. This report is for September, the most recent employment report was for August.
 Click on graph for larger image.
Notice that hires (dark blue) and total separations (red and light blue columns stacked) are pretty close each month. This is a measure of turnover. When the blue line is above the two stacked columns, the economy is adding net jobs - when it is below the columns, the economy is losing jobs.
Jobs openings decreased in September to 3.561 million, down slightly from 3.661 million in August. The number of job openings (yellow) has generally been trending up, and openings are only up about 2% year-over-year compared to September 2011.
Quits decreased in September, and quits are down slightly year-over-year. These are voluntary separations. (see light blue columns at bottom of graph for trend for "quits").
The trend suggests a gradually improving labor market.
Greece Update
by Calculated Risk on 11/06/2012 08:51:00 AM
From Masa Serdarevic at the Financial Times Alphaville: Athens grinds to a halt
The Greek parliament will vote late Wednesday on the structural reforms and budget cuts demanded by the Troika. Reports suggest that the government will be able to get a majority. But in a last minute attempt to derail the vote, the country’s two main labour unions called a 48 hour general strike that started today.Alphaville has some photos of the strike - it looks like a complete mess. Live footage of the strike is here (or talking heads).
From the WSJ: Europe, Central Bank Spar Over Athens Aid
Europe's governments and the European Central Bank are at odds about who should shoulder the financial burden of giving Greece more time to repay its loans and remain part of the euro zone.Still no way out.
The search for a solution for Greece, whether by forgiving some of the money it owes or giving it yet more bailout loans, has come back to haunt the currency union ahead of the ECB's monthly policy meeting on Thursday.
Greece faces a key Treasury-bill repayment in less than two weeks, and the money isn't there unless governments provide additional aid or the ECB agrees to lend Greek banks the money to roll over the debt.
Monday, November 05, 2012
Tuesday: Presidential Election
by Calculated Risk on 11/05/2012 08:02:00 PM
The key event tomorrow is the US election.
Brad Plumer at the WaPo lists a number of projections: Pundit accountability: The official 2012 election prediction thread
Here are the electoral vote predictions from various modelers, political scientists and pundits from around the Internet. All predictions are as of Monday evening. And yes, this will be a fun thread to revisit the day after the election.There is quite a range of predictions. As I've noted, my economic forecasts assume President Obama will be reelected.
Ezra Klein had a great piece today: Neither Obama nor Romney will turn America into a bleak hellscape
We’re at the end of a long and bitter election, and so perhaps it’s worth taking a deep breath and admitting something that typically doesn’t get said until one candidate or the other delivers his concession speech: America will survive either way. Which isn’t to say the policy differences between the candidates aren’t real, and large. They are. But it’s not the end-times showdown that the two sides often suggest.Tuesday:
• At 10:00 AM ET, the Job Openings and Labor Turnover Survey for September will be released by the BLS. The number of job openings has generally been trending up, and openings were up about 13% year-over-year compared to August 2011.
Retailers expect solid Holiday Season
by Calculated Risk on 11/05/2012 04:54:00 PM
On Sunday I noted that October seasonal retail hiring gives a pretty good hint about holiday retail sales, see Retail: Seasonal Hiring vs. Retail Sales
The WSJ reports today: U.S. Retailers Expect Best Holiday Season Since 2007
Leading U.S. retailers expect a 3.7% increase in holiday same-store sales, according to a new survey by BDO USA.However Hurricane Sandy might have a negative impact, from the NY Times: A Storm-Battered Supply Chain Threatens Holiday Shopping
“While we haven’t returned to pre-recession levels of optimism, retailers are gearing up for what looks to be a promising holiday season,” said Doug Hart, partner in the retail and consumer product practice at BDO. “Still, consumers have more choices than ever, and retailers are looking to avoid showrooming by curating a mix of exclusive and top-selling products to get consumers in their door or on their site.”
BDO said despite uncertainty about how the presidential election will affect the economy and consumer spending, the expected increase marks the survey’s most optimistic forecast since 2007, when marketing heads projected a 5% increase in same-store sales.
In addition to shutting down shipping terminals and submerging warehouses, the storm also tangled up deliveries because of downed power lines, closed roads and scarce gasoline in parts of New York and New Jersey.But overall I expect a decent holiday shopping season.
The supply chain is backing up at a crucial time, just as retailers normally bring their final shipments into stores for the holiday shopping season, which retailers depend on for annual profitability.
“Things are slowing down,” said Chris Merritt, vice president for retail supply chain solutions at the trucking company Ryder. “This whole part of the supply chain is clogged up.”
Housing: Inventory down sharply in early November, Impacted by Hurricane Sandy
by Calculated Risk on 11/05/2012 02:22:00 PM
Here is another update using inventory numbers from HousingTracker / DeptofNumbers to track changes in listed inventory. Tom Lawler mentioned this last year.
According to the deptofnumbers.com for (54 metro areas), inventory is off 26.8% compared to the same week last year. However Hurricane Sandy clearly played a role; inventory in New York was off 55% week-over-week, Philadelphia off 66%, and Newark off 25%.
But even after adjusting for the areas impacted by Hurricane Sandy, overall inventory is down 22% year-over-year and probably at the lowest level since the early '00s.
This graph shows the NAR estimate of existing home inventory through September (left axis) and the HousingTracker data for the 54 metro areas through early November.
 Click on graph for larger image.
Since the NAR released their revisions for sales and inventory last year, the NAR and HousingTracker inventory numbers have tracked pretty well.
On a seasonal basis, housing inventory usually bottoms in December and January and then increases through the summer. So inventory will probably decline for the next several months before increasing again next year.
The second graph shows the year-over-year change in inventory for both the NAR and HousingTracker.
 HousingTracker reported that the early November listings, for the 54 metro areas, declined 26.8% from the same period last year.
The year-over-year declines will probably start to get smaller since inventory is already pretty low. Barring a major disaster, it seems very unlikely we will see 20%+ year-over-year declines next summer!
Trulia: Asking House Prices increased in October
by Calculated Risk on 11/05/2012 11:59:00 AM
Press Release: Trulia Reports October Asking Prices Rise 2.9% Year-over-Year, But Rents Rise Faster at 5.1%
In October, asking prices rose 0.7% month-over-month, for a 2.9% year-over-year increase – the biggest yearly gain in the Trulia Price Monitor to date. More than two thirds of large metros – 69 out of 100 – had year-over-year price increases. The month-over-month and quarter-over-quarter price increases are larger when foreclosures are included than when they’re excluded – which means foreclosure prices are now rising faster than prices on non-distressed homes.These asking prices are SA (Seasonally Adjusted) - and adjusted for the mix of homes - and this suggests further house price increases over the next few months on a SA basis.
...
Rents Up 5.1% Year-over-Year – and Rising Even in Markets Where Prices are Falling
Rents have increased year-over-year in 24 of the 25 largest rental markets – all except Las Vegas. Rents are rising alongside big price gains in Oakland, Denver, and San Francisco; people looking for a home in these markets will find bargains disappearing whether they’re looking to rent or own. But rents are also rising sharply in Chicago and Philadelphia, despite falling for-sale prices.
...
“Continued widespread price increases are good for homeowners but not for home-seekers,” said Jed Kolko, Trulia’s Chief Economist. “For homeowners, rising prices add to their wealth and help bring underwater borrowers closer to positive equity. For home-seekers, however, rising prices could put homeownership out of reach. In markets like Denver, San Francisco, and Oakland, where prices and rents are both rising, higher prices mean higher down payments, but rising rents make it harder to save enough.”
More from Jed Kolko, Trulia Chief Economist: Asking Prices Rise Yet Again in October, But Rents Rise Faster


