by Calculated Risk on 10/24/2012 10:00:00 AM
Wednesday, October 24, 2012
New Home Sales at 389,000 SAAR in September
The Census Bureau reports New Home Sales in September were at a seasonally adjusted annual rate (SAAR) of 389 thousand. This was up from a revised 368 thousand SAAR in August (revised down from 373 thousand). This is the highest level since April 2010 (tax credit related bounce).
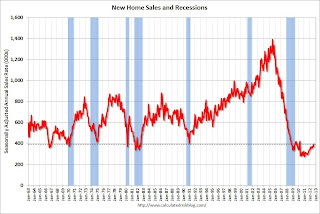
The first graph shows New Home Sales vs. recessions since 1963. The dashed line is the current sales rate.
Sales of new single-family houses in September 2012 were at a seasonally adjusted annual rate of 389,000 ... This is 5.7 percent above the revised August rate of 368,000 and is 27.1 percent above the September 2011 estimate of 306,000.
 Click on graph for larger image in graph gallery.
The second graph shows New Home Months of Supply.
The months of supply declined in September to 4.5 months. August was revised up to 4.6 months.
The all time record was 12.1 months of supply in January 2009.
 This is now in the normal range (less than 6 months supply is normal).
The seasonally adjusted estimate of new houses for sale at the end of September was 145,000. This represents a supply of 4.5 months at the current sales rate.On inventory, according to the Census Bureau:
"A house is considered for sale when a permit to build has been issued in permit-issuing places or work has begun on the footings or foundation in nonpermit areas and a sales contract has not been signed nor a deposit accepted."Starting in 1973 the Census Bureau broke this down into three categories: Not Started, Under Construction, and Completed.
 This graph shows the three categories of inventory starting in 1973.
The inventory of completed homes for sale was at a record low 38,000 units in September. The combined total of completed and under construction is just above the record low since "under construction" is starting to increase.
The last graph shows sales NSA (monthly sales, not seasonally adjusted annual rate).
In September 2012 (red column), 31 thousand new homes were sold (NSA). Last year only 24 thousand homes were sold in September. This was the sixth weakest September since this data has been tracked (above 2011, 2010, 2009, 1981 and 1966). The high for September was 99 thousand in 2005.
 Even though sales are still very low, new home sales have clearly bottomed. New home sales have averaged 364 thousand SAAR over the first 9 months of 2012, after averaging under 300 thousand for the previous 18 months. Sales are finally above the lows for previous recessions too.
This was slightly above expectations of 385,000, and was another fairly solid report. This indicates an ongoing recovery in residential investment.
MBA:Mortgage Applications Decrease in Latest MBA Weekly Survey
by Calculated Risk on 10/24/2012 07:03:00 AM
From the MBA: Mortgage Applications Decrease in Latest MBA Weekly Survey
The Refinance Index decreased 13 percent from the previous week to the lowest level since late August. The seasonally adjusted Purchase Index decreased 8 percent from one week earlier.
The average contract interest rate for 30-year fixed-rate mortgages with conforming loan balances ($417,500 or less) increased to 3.63 percent from 3.57 percent, with points increasing to 0.45 from 0.44 (including the origination fee) for 80 percent loan-to-value ratio (LTV) loans.
 Click on graph for larger image.
The first graph shows the refinance index.
The refinance activity is down about 20% over the last three weeks, but activity is still very high - and will probably remain high with mortgage rates near record lows.
The MBA expects mortgage originations to decline next year: MBA Sees 2013 Residential Mortgage Originations Hitting $1.3 Trillion, Revises 2012 Estimate Upward to $1.7 trillion
The Mortgage Bankers Association (MBA) expects to see $1.3 trillion in mortgage originations during 2013, largely driven by a spillover of refinances into the first half of the year. MBA also upwardly revised its estimate of originations for 2012 to $1.7 trillion. MBA expects to see purchase originations climb to $585 billion in 2013, up from a revised estimate of $503 billion for 2012. In contrast, refinances are expected to fall to $785 billion in 2013, down from a revised estimate of $1.2 trillion in 2012.
“We expected 2012 originations to be front-loaded in the first half of the year, with refis falling off with rate increases. Instead we saw the refinance market grow during the year due to a combination of low rates, thanks to QE3 and slowing global growth because of continuing problems in Europe, and adjustments in the HARP and FHA refinance programs,” said Jay Brinkmann, MBA’s Chief Economist. “We expect 2013 refinance originations to play out like our original expectations for 2012, with a long tail of refis extending through the first half of the year followed by a rapid drop-off in the second half.”
Brinkmann continued, “In contrast, we expect a 16% increase in purchase originations in 2013 over 2012, with every quarter in 2013 exceeding the same quarter of 2012. The increase in purchase volumes will be driven by continued modest growth in the economy, an increase in owner-occupied sales financed with mortgages as opposed to cash purchases by investors, an increase in new home sales and a small increase in average home prices. "
 The second graph shows the MBA mortgage purchase index. The purchase index has been mostly moving sideways over the last two years.
The MBA expects this index to start increasing in 2013.
Tuesday, October 23, 2012
Wednesday: New Home Sales, FOMC Announcement
by Calculated Risk on 10/23/2012 09:03:00 PM
The FHFA house price index for August was released late today (GSE loans). FHFA House Price Index Up 0.7 Percent in August:
U.S. house prices rose 0.7 percent on a seasonally adjusted basis from July to August, according to the Federal Housing Finance Agency’s monthly House Price Index (HPI). The previously reported 0.2 percent increase in July was revised downward to a 0.1 percent increase. For the 12 months ending in August, U.S. prices rose 4.7 percent. The U.S. index is 15.9 percent below its April 2007 peak and is roughly the same as the June 2004 index level.This was above the consensus of a 0.4% increase in August.
Wednesday:
• At 7:00 AM ET, the Mortgage Bankers Association (MBA) will release the mortgage purchase applications index.
• At 9:00 AM, the Markit US PMI Manufacturing Index Flash will be released. This is a new release and might provide hints about the ISM PMI for October. The consensus is for a reading of 51.5, unchanged from September.
• At 10:00 AM, New Home Sales for September will be released by the Census Bureau. The consensus is for an increase in sales to 385 thousand Seasonally Adjusted Annual Rate (SAAR) in August from 373 thousand in August. Watch for possible upgrades to the sales rates for previous months.
• At 2:15 PM, the FOMC Meeting statement will be released. No significant changes are expected. I posted a FOMC preview yesterday.
• During the day: The AIA's Architecture Billings Index for September (a leading indicator for commercial real estate).
Another question for the October economic prediction contest (Note: You can now use Facebook, Twitter, or OpenID to log in).
Update: REO by State and Owner Occupied Units by State
by Calculated Risk on 10/23/2012 07:26:00 PM
To help put the previous post in perspective, I've added the number of owner occupied units as of April 1, 2010 (from the decennial Census), and the percent of units that are REO.
REOs are only part of the puzzle. This just shows how many lender Real Estate Owned (REO) units for each state. But look at New Jersey. There are very few REOs in New Jersey, but there are many properties in the foreclosure process.
If you look at the NY Fed site, they mark the judicial foreclosure states with a black square. Many of the judicial states are backlogged. See Serious Mortgage Delinquencies and In-Foreclosure by State for graphs of the percent of loans in foreclosure and serious delinquent by state (as of the end of Q2).
Here are a repeat of Tom Lawler's comments:
Folks interested in REO inventories by state might want to take at look at the website below from the FRB of New York. According to the FRBoNY, the data were “provided by CoreLogic under contract.”
An Assessment of the Distressed Residential Real Estate Situation
The site shows a map and you have to click on each state to get data, and I couldn’t get DC (I don’t think it was available!), but here’s the data for June 30, 2012
| Number of REO by State, June 2012 | |||
|---|---|---|---|
| Number of REO | Owner Occupied Housing Units April, 2010 | Percent of Units REO | |
| Northeast | |||
| Connecticut | 2,345 | 925,286 | 0.25% |
| Maine | 910 | 397,417 | 0.23% |
| Massachusetts | 7,501 | 1,587,158 | 0.47% |
| New Hampshire | 2,847 | 368,316 | 0.77% |
| New Jersey | 1,979 | 2,102,465 | 0.09% |
| New York | 2,557 | 3,897,837 | 0.07% |
| Pennsylvania | 7,712 | 3,491,722 | 0.22% |
| Rhode Island | 2,110 | 250,952 | 0.84% |
| Vermont | 264 | 181,407 | 0.15% |
| South | |||
| Alabama | 7,644 | 1,312,589 | 0.58% |
| Arkansas | 1,027 | 768,156 | 0.13% |
| Delaware | 1,163 | 246,724 | 0.47% |
| District of Columbia | NA | 112,055 | NA |
| Florida | 44,677 | 4,998,979 | 0.89% |
| Georgia | 33,537 | 2,354,402 | 1.42% |
| Kentucky | 4,442 | 1,181,271 | 0.38% |
| Louisiana | 4,756 | 1,162,299 | 0.41% |
| Maryland | 4,614 | 1,455,775 | 0.32% |
| Mississippi | 2,907 | 777,073 | 0.37% |
| North Carolina | 12,005 | 2,497,900 | 0.48% |
| Oklahoma | 3,009 | 981,760 | 0.31% |
| South Carolina | 5,775 | 1,248,805 | 0.46% |
| Tennessee | 10,575 | 1,700,592 | 0.62% |
| Texas | 22,528 | 5,685,353 | 0.40% |
| Virginia | 8,810 | 2,055,186 | 0.43% |
| West Virginia | 1,780 | 561,013 | 0.32% |
| Midwest | |||
| Illinois | 33,584 | 3,263,639 | 1.03% |
| Indiana | 7,548 | 1,747,975 | 0.43% |
| Iowa | 2,792 | 880,635 | 0.32% |
| Kansas | 3,540 | 753,532 | 0.47% |
| Michigan | 38,275 | 2,793,342 | 1.37% |
| Minnesota | 16,761 | 1,523,859 | 1.10% |
| Missouri | 10,821 | 1,633,610 | 0.66% |
| Nebraska | 1,184 | 484,730 | 0.24% |
| North Dakota | 128 | 183,943 | 0.07% |
| Ohio | 18,533 | 3,111,054 | 0.60% |
| South Dakota | 471 | 219,558 | 0.21% |
| Wisconsin | 9,807 | 1,551,558 | 0.63% |
| West | |||
| Alaska | 494 | 162,765 | 0.30% |
| Arizona | 12,465 | 1,571,687 | 0.79% |
| California | 49,299 | 7,035,371 | 0.70% |
| Colorado | 8,596 | 1,293,100 | 0.66% |
| Hawaii | 936 | 262,682 | 0.36% |
| Idaho | 2,131 | 404,903 | 0.53% |
| Montana | 826 | 278,418 | 0.30% |
| Nevada | 7,882 | 591,480 | 1.33% |
| New Mexico | 2,575 | 542,122 | 0.47% |
| Oregon | 4,452 | 944,485 | 0.47% |
| Utah | 4,193 | 618,137 | 0.68% |
| Washington | 7,461 | 1,673,920 | 0.45% |
| Wyoming | 905 | 157,077 | 0.58% |
| Total (ex-DC) | 443,133 | 75,986,074 | 0.58% |
Lawler: Estimated REO Inventories by State
by Calculated Risk on 10/23/2012 04:42:00 PM
CR Note: This is a very useful website. The estimate of lender Real Estate Owned (REO) in June was very close to the bottom up estimate using data from the FHA, Fannie, Freddie, the FDIC and more.
From economist Tom Lawler:
Folks interested in REO inventories by state might want to take at look at the website below from the FRB of New York. According to the FRBoNY, the data were “provided by CoreLogic under contract.”
An Assessment of the Distressed Residential Real Estate Situation
The site shows a map and you have to click on each state to get data, and I couldn’t get DC (I don’t think it was available!), but here’s the data for June 30, 2012
| Number of REO by State, June 2012 | |
|---|---|
| Northeast | |
| Connecticut | 2,345 |
| Maine | 910 |
| Massachusetts | 7,501 |
| New Hampshire | 2,847 |
| New Jersey | 1,979 |
| New York | 2,557 |
| Pennsylvania | 7,712 |
| Rhode Island | 2,110 |
| Vermont | 264 |
| South | |
| Alabama | 7,644 |
| Arkansas | 1,027 |
| Delaware | 1,163 |
| District of Columbia | |
| Florida | 44,677 |
| Georgia | 33,537 |
| Kentucky | 4,442 |
| Louisiana | 4,756 |
| Maryland | 4,614 |
| Mississippi | 2,907 |
| North Carolina | 12,005 |
| Oklahoma | 3,009 |
| South Carolina | 5,775 |
| Tennessee | 10,575 |
| Texas | 22,528 |
| Virginia | 8,810 |
| West Virginia | 1,780 |
| Midwest | |
| Illinois | 33,584 |
| Indiana | 7,548 |
| Iowa | 2,792 |
| Kansas | 3,540 |
| Michigan | 38,275 |
| Minnesota | 16,761 |
| Missouri | 10,821 |
| Nebraska | 1,184 |
| North Dakota | 128 |
| Ohio | 18,533 |
| South Dakota | 471 |
| Wisconsin | 9,807 |
| West | |
| Alaska | 494 |
| Arizona | 12,465 |
| California | 49,299 |
| Colorado | 8,596 |
| Hawaii | 936 |
| Idaho | 2,131 |
| Montana | 826 |
| Nevada | 7,882 |
| New Mexico | 2,575 |
| Oregon | 4,452 |
| Utah | 4,193 |
| Washington | 7,461 |
| Wyoming | 905 |
| Total (ex-DC) | 443,133 |
ATA Trucking Index increases in September
by Calculated Risk on 10/23/2012 01:58:00 PM
Note: ATA Chief Economist Bob Costello says, for trucking, the pickup in housing is offsetting the "flattening in manufacturing output".
From ATA: ATA Truck Tonnage Index Rose 0.4% in September
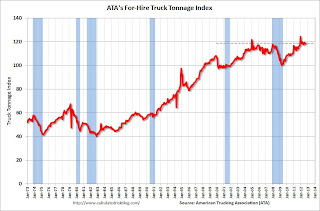
The American Trucking Associations’ advanced seasonally adjusted (SA) For-Hire Truck Tonnage Index increased 0.4% in September after falling 0.9% in August. In September, the SA index equaled 118.7 (2000=100). The level in September was the same as in January 2012, so the index has been on a flat trend-line over the past 9 months. Compared with September 2011, the SA index was 2.4% higher, the smallest year-over-year increase since December 2009.Note from ATA:
...
“The year-over-year deceleration in tonnage continued during September, although I was encouraged that the seasonally adjusted index edged higher from August,” ATA Chief Economist Bob Costello said. Costello noted again this month that the acceleration in housing starts, which is helping truck tonnage, is being countered by a flattening in manufacturing output and elevated inventories throughout the supply chain."
emphasis added
Trucking serves as a barometer of the U.S. economy, representing 67% of tonnage carried by all modes of domestic freight transportation, including manufactured and retail goods. Trucks hauled 9.2 billion tons of freight in 2011. Motor carriers collected $603.9 billion, or 80.9% of total revenue earned by all transport modes.
 Click on graph for larger image.
Here is a long term graph that shows ATA's For-Hire Truck Tonnage index.
The dashed line is the current level of the index. The index is above the pre-recession level and up 2.4% year-over-year - but has been mostly moving sideways in 2012.
Fed: State Coincident Indexes in September show improvement
by Calculated Risk on 10/23/2012 12:08:00 PM
From the Philly Fed:
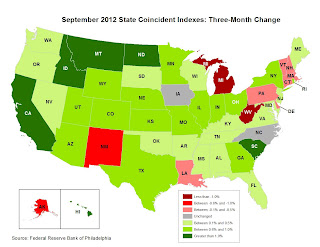
The Federal Reserve Bank of Philadelphia has released the coincident indexes for the 50 states for September 2012. In the past month, the indexes increased in 39 states, decreased in five states, and remained stable in six states, for a one-month diffusion index of 68. Over the past three months, the indexes increased in 37 states, decreased in 11 states, and remained stable in two states, for a three-month diffusion index of 52. For comparison purposes, the Philadelphia Fed has also developed a similar coincident index for the entire United States. The Philadelphia Fed’s U.S. index rose 0.2 percent in September and 0.6 percent over the past three months.Note: These are coincident indexes constructed from state employment data. From the Philly Fed:
The coincident indexes combine four state-level indicators to summarize current economic conditions in a single statistic. The four state-level variables in each coincident index are nonfarm payroll employment, average hours worked in manufacturing, the unemployment rate, and wage and salary disbursements deflated by the consumer price index (U.S. city average). The trend for each state’s index is set to the trend of its gross domestic product (GDP), so long-term growth in the state’s index matches long-term growth in its GDP.
 Click on graph for larger image.
This is a graph is of the number of states with one month increasing activity according to the Philly Fed. This graph includes states with minor increases (the Philly Fed lists as unchanged).
In September, 41 states had increasing activity, up from 33 in August (including minor increases). This is the second consecutive year with a weak spot during the summer, and improvement towards the end of the year.
 Here is a map of the three month change in the Philly Fed state coincident indicators. This map was all red during the worst of the recession.
 The map was all green earlier this year and is starting to turn mostly green again.
Richmod Fed Mfg Survey indicates contraction in October
by Calculated Risk on 10/23/2012 10:00:00 AM
From the Richmond Fed: Manufacturing Activity Pulled Back in October; Optimism Wanes
Manufacturing activity in the central Atlantic region pulled back in October after improving somewhat last month, according to the Richmond Fed's latest survey. The seasonally adjusted index of overall activity was pushed lower as all broad indicators of activity — shipments, new orders and employment — were in negative territory.This suggests contraction in manufacturing activity in the central Atlantic region. It appears some of this contraction may be due to the European recession and reduced exports to Europe.
...
Looking forward, assessments of business prospects for the next six months were less optimistic in October. Contacts at more firms anticipated that new orders, backlogs, capacity utilization, and vendor lead-times will grow more slowly than anticipated a month ago.
...
In October, the seasonally adjusted composite index of manufacturing activity — our broadest measure of manufacturing — lost eleven points to −7 from September's reading of 4. Among the index's components, shipments fell eighteen points to −9, new orders moved down thirteen points to finish at −6, and the jobs index held steady at −5.
Bank of Spain: Recession Continues, Deficit to Increase
by Calculated Risk on 10/23/2012 08:37:00 AM
From the WSJ: Bank of Spain Warns on Deficit Targets
Spain's central bank said Tuesday the country's economy contracted slightly less than expected in the third quarter but repeated a warning that tax-revenue shortfalls could cause the government to miss its 2012 budget-deficit target.Another austerity data point. Still the Spanish bond yields are down from the levels of a few months ago with the 10-year yield at 5.55%, and the 2-year yield at 2.98%.
The euro zone's fourth-largest economy contracted by 0.4%, the same as in the second quarter, the Bank of Spain said in a quarterly report. On an annual basis, the contraction was 1.7% ...
The government has said its deficit will rise to 7.4% of GDP this year ...
"The efforts to lower spending at the public sector have had a net contracting effect (on the economy) in the central months of the year," the central bank said. "We see drops in consumption and investment by all levels of government above those seen in previous quarters."
emphasis added
Monday, October 22, 2012
Tuesday: Richmond Fed Mfg Survey
by Calculated Risk on 10/22/2012 07:47:00 PM
There will be plenty of economic data released later this week! There is some sort of political debate tonight at 9 PM ET. The good news is the election will be over on November 6th. The bad news, as Atrios mentioned earlier, is the 2016 election cycle starts on Nov 7th.
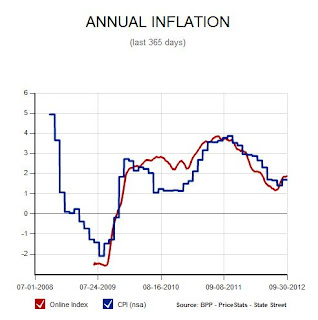
Here is something I like to check occasionally as a different measure for inflation in addition to to CPI from the BLS.
This is the US only index of the MIT Billion Prices Project.
This index uses prices for online goods. From MIT:
These indexes are designed to provide real-time information on major inflation trends, not to forecast official inflation announcements. We are constantly adding new categories of goods, but we do not cover 100% of CPI goods and services. The price of services, in particular, are not easy to find online and therefore are not included in our statistics.
 Click on graph for larger image.
It appears that year-over-year inflation, according to this measure, is under 2.0%. This is another measure that suggests inflation is not currently a problem.
On Tuesday:
• At 10:00 AM ET, the Richmond Fed Survey of Manufacturing Activity for October will be released. The consensus is for an increase to 6 for this survey from 4 in September (above zero is expansion).


