by Calculated Risk on 10/04/2012 08:30:00 AM
Thursday, October 04, 2012
Weekly Initial Unemployment Claims increase to 367,000
The DOL reports:
In the week ending September 29, the advance figure for seasonally adjusted initial claims was 367,000, an increase of 4,000 from the previous week's revised figure of 363,000. The 4-week moving average was 375,000, unchanged from the previous week's revised average.The previous week was revised up from 359,000.
The following graph shows the 4-week moving average of weekly claims since January 2000.

Click on graph for larger image.
The dashed line on the graph is the current 4-week average. The four-week average of weekly unemployment claims was unchanged at 375,000.
This was lower than the consensus forecast of 370,000.

And here is a long term graph of weekly claims:
Mostly moving sideways this year ...
Wednesday, October 03, 2012
Thursday: Mall Vacancy Rate, Unemployment Claims, FOMC Minutes
by Calculated Risk on 10/03/2012 08:16:00 PM
There is a presidential debate tonight starting at 9 PM ET. The Wonkblog promises to "provide real time context for the many statistics and ideas".
There was a sharp decline in oil prices today, from Bloomberg: Oil Tumbles as [US} Crude Production Surges to 15-Year High
Oil fell to a two-month low in New York after the government reported that U.S. crude production climbed to the highest level in more than 15 years and fuel consumption decreased.On Thursday:
Futures dropped 4.1 percent after the Energy Department said crude output rose 11,000 barrels a day to 6.52 million last week, the most since December 1996. Total fuel demand fell 0.3 percent to 18.3 million barrels a day in the four weeks ended Sept. 28, the lowest level since April.
Brent oil for November settlement decreased $3.40, or 3 percent, to end the session at $108.17 a barrel on the London- based ICE Futures Europe exchange, the lowest close since Aug. 2.
• Early: Reis will release the Q3 2012 Mall vacancy rates. Last quarter Reis reported a small decline in the vacancy rate for regional malls at 8.9%. For Neighborhood and Community malls (strip malls), the vacancy rate declined to 10.8% in Q2, from 10.9% in Q1.
• At 7:45 AM, the European Central Bank announcement with a press conference to follow.
• At 8:30 AM, the initial weekly unemployment claims report will be released. The consensus is for claims to increase to 370 thousand from 359 thousand.
• At 10:00 AM, the Manufacturers' Shipments, Inventories and Orders (Factory Orders) report for August will be released. The consensus is for a 6.0% decrease in orders..
• Also at 10:00 AM, the Trulia Price Rent Monitors for September will be released. This is the new index from Trulia that uses asking prices adjusted both for the mix of homes listed for sale and for seasonal factors.
• At 2:00 PM, the FOMC Minutes for Meeting of September 12-13, 2012 will be released. The minutes might provide additional information about the recent Fed decision.
U.S. Births Decline for the fourth consecutive year in 2011
by Calculated Risk on 10/03/2012 04:37:00 PM
From the National Center for Health Statistics: Births: Preliminary Data for 2011. The NCHS reports:
The 2011 preliminary number of US births was 3,953,593, 1 percent less (or 45,793 fewer) births than in 2010; the general fertility rate (63.2 per 1,000 women age 15-44 years) declined to the lowest rate ever reported for the United States.Here is a long term graph of annual U.S. births through 2010 ...
The birth rate for teenagers 15-19 years fell 8 percent in 2011 (31.3 births per 1,000 teenagers 15-19 years), another record low ... The birth rates for women in their twenties declined as well, to a historic low for women aged 20-24 (85.3 births per 1,000). The birth rate for women in their early thirties was unchanged in 2011 but rose for women aged 35-39 and 40-44.
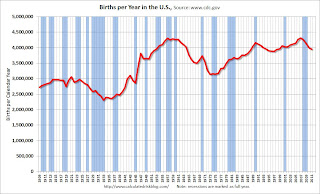 Click on graph for larger image in new window.
Births have declined for four consecutive years, and are now 8.4% below the peak in 2007 (births in 2007 were at the all time high - even higher than during the "baby boom"). I suspect certain segments of the population were under stress before the recession started - like construction workers - and even more families were in distress in 2008 through 2011. And this led to fewer babies.
As an example, it appears younger women have delayed having children, but the birth rate was unchanged for women in their early 30s - and rose for older women (the groups that can't wait much longer).
Notice that the number of births started declining a number of years before the Great Depression started. Many families in the 1920s were under severe stress long before the economy collapsed. By 1933 births were down by almost 23% from the early '20s levels.
Of course economic distress isn't the only reason births decline - look at the huge decline following the baby boom that was driven by demographics. But it is not surprising that the number of births slow or decline during tough economic times - and that appears to have happened once again.
I don't think the percentage decline in births will be anything like what happened during the Depression, but a 8.4% decline is pretty significant. My guess is births will increase in 2012 as confidence slowly improves.
LPS: Mortgage prepayment rates highest since 2005
by Calculated Risk on 10/03/2012 01:32:00 PM
LPS released their Mortgage Monitor report for August today. According to LPS, 6.87% of mortgages were delinquent in August, down from 7.03% in July, and down from 7.68%% in August 2011.
LPS reports that 4.04% of mortgages were in the foreclosure process, down slightly from 4.08% in July, and down from 4.12% in August 2011.
This gives a total of 10.91% delinquent or in foreclosure. It breaks down as:
• 1,910,000 properties that are 30 or more days, and less than 90 days past due, but not in foreclosure.
• 1,520,000 properties that are 90 or more days delinquent, but not in foreclosure.
• 2,020,000 loans in foreclosure process.
For a total of 5,450,000 loans delinquent or in foreclosure in August. This is down from 5,562,000 last month, and down from 6,080,000 in August 2011.
This following graph shows the total delinquent and in-foreclosure rates since 1995.
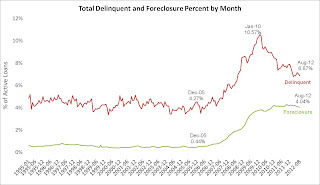 Click on graph for larger image.
The total delinquency rate has fallen to 6.87% from the peak in July 2010 of 10.57%. A normal rate is probably in the 4% to 5% range, so there is a long ways to go.
The in-foreclosure rate was at 4.04%. There are still a large number of loans in this category (about 2 million), but it appears this is starting to decline.
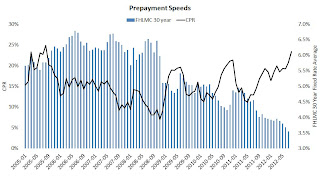 The second graph shows prepayment speeds vs. mortgage rates. CPR is conditional prepayment rate, a ratio of prepayments to outstandings.
From LPS:
[P]repayment rates in August rose above those seen in the “mini refinance waves” of both 2009 and 2010, hitting their highest levels since 2005. LPS Applied Analytics Senior Vice President Herb Blecher explains that the impact of this increase has been both pronounced and broad-based.
“Our analysis showed an increase in prepayment activity across the entire combined loan-to-value (CLTV) continuum,” Blecher said. “While those loans with equity, particularly 80 percent CLTV and below, have much higher prepayment speeds, the impact of the Obama Administration’s Home Affordable Refinance Program (HARP) was also clear. Loans with a CLTV of more than 120 percent saw the greatest uptick – a 65 percent increase for the year to date. However, it is also becoming evident that loans originated in 2007 and earlier have diminished prospects for conventional refinancing opportunities. Fewer than 30 percent of these vintages remain both active and current, and on average, they are marked by larger negative equity positions and lower credit scores. That said, HARP might yet represent a viable refi option for a good portion of this pool.”
Reis: Apartment Vacancy Rate declined slightly to 4.6% in Q3, More Supply coming in 2013
by Calculated Risk on 10/03/2012 11:42:00 AM
Reis reported that the apartment vacancy rate (82 markets) fell slightly to 4.6% in Q3, down from 4.7% in Q1 2012. The vacancy rate was at 5.6% in Q3 2011 and peaked at 8.0% at the end of 2009.
Some data and comments from economist Dr. Victor Calanog at Reis:
3Q Vacancy Rate: 4.6%, down 10 bps from second quarter’s 4.7%
3Q Absorption: 22,615, down from the second quarter’s 31,014 and the first quarter’s 36,423
3Q Completions: 13,531 units (similar to the second quarter’s figure of 13,370 units
"The national vacancy rate barely fell, inching downward from 4.7% to 4.6%, during a quarter that usually exhibits seasonal strength. This is the slowest rate of improvement since the recovery began in early 2010. For perspective, note that vacancies declined by an average of 35 basis points per quarter in 2010 and 2011; this year, vacancies fell by 30 basis points in the first quarter, 20 basis points in the second quarter, and 10 basis points in the third.
Net absorption, or the net change in occupied stock, slowed accordingly. Only 22,615 units were leased up in the third quarter, a clear trend downwards from the second quarter’s figure of 31,014 and the first quarter’s figure of 36,423. This is the lowest rate of absorption since the first quarter of 2010, and represents less than half the quarterly average rate of about 50,000 units that the sector enjoyed in 2010 and 2011.
Inventory growth continued at about the same pace as the second quarter, with 13,531 units coming online. This is still a relatively restrained pace for new construction, and demand for apartments still clearly outstrips supply growth, with absorption figures higher than construction, and vacancies declining. Still, there is cause for concern in the near‐term that demand is abating for multifamily, just as a veritable avalanche of new projects begins to open their doors early next year.
...
There are two fundamental risks in the near future: first, that demand for apartments will not be as robust. Home prices have shown a clear upward trend in recent months, with data from multiple sources all consistently reporting higher home prices and stronger figures for net home orders; it is notoriously difficult to trace a direct correlation between single‐family home prices and demand for multifamily rentals, and linking individual decisions to either buy a single‐family home or rent a multifamily apartment is challenging. Low mortgage rates have not prompted many households to buy homes, given expectations that home prices will remain flat. But that trend might finally be shifting: as home prices rise, households may feel a greater impetus to consider buying homes while mortgage rates remain low, and before prices rise “too much.” This will tend to depress demand for apartment rentals.
The second risk for the apartment sector is the predictable spike in new construction, a big wave of which is expected to come online starting in 2013".
 Click on graph for larger image.
This graph shows the apartment vacancy rate starting in 1980. (Annual rate before 1999, quarterly starting in 1999).
Reis is just for large cities. It appears that the declines in vacancy rates is slowing, and rent increases might slow too. Also, as Calanog notes, there will be a significant increase in new supply in 2013 (and in 2014).
ISM Non-Manufacturing Index increases in September
by Calculated Risk on 10/03/2012 10:00:00 AM
The September ISM Non-manufacturing index was at 55.1%, up from 53.7% in August. The employment index decreased in September to 51.1%, down from 53.8% in August. Note: Above 50 indicates expansion, below 50 contraction.
From the Institute for Supply Management: September 2012 Non-Manufacturing ISM Report On Business®
Economic activity in the non-manufacturing sector grew in September for the 33rd consecutive month, say the nation's purchasing and supply executives in the latest Non-Manufacturing ISM Report On Business®.
The report was issued today by Anthony Nieves, C.P.M., CFPM, chair of the Institute for Supply Management™ Non-Manufacturing Business Survey Committee. "The NMI™ registered 55.1 percent in September, 1.4 percentage points higher than the 53.7 percent registered in August. This indicates continued growth this month at a faster rate in the non-manufacturing sector. The Non-Manufacturing Business Activity Index registered 59.9 percent, which is 4.3 percentage points higher than the 55.6 percent reported in August, reflecting growth for the 38th consecutive month. The New Orders Index increased by 4 percentage points to 57.7 percent. The Employment Index decreased by 2.7 percentage points to 51.1 percent, indicating growth in employment for the second consecutive month but at a slower rate. The Prices Index increased 3.8 percentage points to 68.1 percent, indicating higher month-over-month prices when compared to August. According to the NMI™, 12 non-manufacturing industries reported growth in September. Respondents' comments continue to be mixed; however, the majority indicate a slightly more positive perspective on current business conditions."
 Click on graph for larger image.
This graph shows the ISM non-manufacturing index (started in January 2008) and the ISM non-manufacturing employment diffusion index.
This was above the consensus forecast of 53.5% and indicates faster expansion in September than in August. The internals were mixed with the employment index down, but new orders up.
ADP: Private Employment increased 162,000 in September
by Calculated Risk on 10/03/2012 08:18:00 AM
ADP reports:
Employment in the U.S. nonfarm private business sector increased by 162,000 from August to September, on a seasonally adjusted basis. The estimated gains in previous months were revised lower: the July increase was reduced by 17,000 to an increase of 156,000, while the August increase was reduced by 12,000 to an increase of 189,000This was above the consensus forecast of an increase of 140,000 private sector jobs in September. The BLS reports on Friday, and the consensus is for an increase of 113,000 payroll jobs in September, on a seasonally adjusted (SA) basis.
Employment in the private, service-providing sector expanded 144,000 in September, down from 175,000 in August.
ADP hasn't been very useful in predicting the BLS report, but this suggests a stronger than consensus report.
MBA: Mortgage Refinance Applications increases sharply, Highest Since 2009
by Calculated Risk on 10/03/2012 07:01:00 AM
From the MBA: Mortgage Refinance Applications Highest Since 2009 as Rates Reach Record Lows in Latest MBA Weekly Survey
The Refinance Index increased 20 percent from the previous week. This was the highest Refinance Index recorded in the survey since April of 2009. The seasonally adjusted Purchase Index increased 4 percent from one week earlier.
“Refinance application volume jumped to the highest level in more than three years last week as each of the five mortgage rates in MBA's survey dropped to new record lows in the survey,” said Mike Fratantoni, MBA’s Vice President of Research and Economics. “Financial markets continue to adjust to QE3, as the ongoing presence of the Federal Reserve as a significant buyer of mortgage-backed securities applies downward pressure on rates."
The average contract interest rate for 30-year fixed-rate mortgages with conforming loan balances ($417,500 or less) decreased to 3.53 percent from 3.63 percent, with points decreasing to 0.35 from 0.41 (including the origination fee) for 80 percent loan-to-value ratio (LTV) loans.
 Click on graph for larger image.
The first graph shows the refinance index.
The refinance activity is at the highest level since 2009. Refinance activity has been generally moving up over the last year, and really took off last week.
 The second graph shows the MBA mortgage purchase index. The purchase index is up 5% over the last two weeks.
However the purchase index has been mostly moving sideways over the last two years.
Tuesday, October 02, 2012
Wednesday: Apartment Vacancy Rate, ISM Service Index, ADP Employment
by Calculated Risk on 10/02/2012 09:16:00 PM
Goldman Sachs released a research note today on house prices: "House Price News Continues to Be Good". In the note, economists Hui Shan and Sven Jari Stehn provide some projections:
[W]e provide an upside and a downside scenario for house prices in addition to our baseline projection. ... We construct the upside and downside cases by incorporating both economic scenarios and modeling uncertainties. ... Although our methodology does not allow us to precisely estimate the probability of each constructed scenario, one can roughly consider the upside and downside as the one standard deviation above and below the baseline.
[Our] model now projects house price gains of 2.0% from mid-2012 to mid-2013, and 2.8% in the year thereafter (Exhibit 1). This baseline forecast is broadly in line with the latest consensus forecast. Exhibit 1 also shows our scenario analysis, pointing to house price appreciation of 9.1% (4.1% for 2012Q2-2013Q2 and 5.0% for 2013Q2-2014Q2) and -0.4% (-0.2% for 2012Q2-2013Q2 and -0.2% for 2013Q2-2014Q2) over the next two years, respectively, for the upside and downside alternative scenarios.
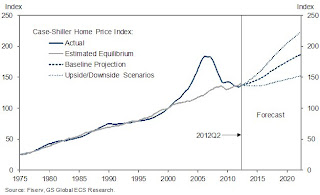 Click on graph for larger image.
Here is exhibit 1 from the research note showing Goldman's baseline forecast, and upside and downside scenarios.
On Wednesday:
• Early: Reis will release the Q3 2012 Apartment vacancy rates. Last quarter Reis reported that the apartment vacancy rate declined to 4.7% in Q2 from 4.9% in Q1 2012. This was the lowest vacancy rate since Q4 2001.
• At 7:00 AM, The Mortgage Bankers Association (MBA) will release the mortgage purchase applications index. Excerpt a surge in refinance activity with low mortgage rates.
• At 8:15 AM, the ADP Employment Report for September will be released. This report is for private payrolls only (no government). The consensus is for 140,000 payroll jobs added in August, down from the 201,000 reported last month.
• At 10:00 AM, the ISM non-Manufacturing Index for September will be released. The consensus is for a decrease to 53.5 from 53.7 in August. Note: Above 50 indicates expansion, below 50 contraction.
Another question for the October economic prediction contest (Note: You can now use Facebook, Twitter, or OpenID to log in).
Housing: Inventory down 21% year-over-year in early October
by Calculated Risk on 10/02/2012 07:25:00 PM
Here is another update using inventory numbers from HousingTracker / DeptofNumbers to track changes in listed inventory. Tom Lawler mentioned this last year.
According to the deptofnumbers.com for (54 metro areas), inventory is off 21.4% compared to the same week last year. Unfortunately the deptofnumbers only started tracking inventory in April 2006.
This graph shows the NAR estimate of existing home inventory through August (left axis) and the HousingTracker data for the 54 metro areas through early October.
 Click on graph for larger image.
Since the NAR released their revisions for sales and inventory last year, the NAR and HousingTracker inventory numbers have tracked pretty well.
On a seasonal basis, housing inventory usually bottoms in December and January and then increases through the summer. Inventory only increased a little this spring and has been declining for the last five months by this measure. It looks like inventory peaked early this year.
The second graph shows the year-over-year change in inventory for both the NAR and HousingTracker.
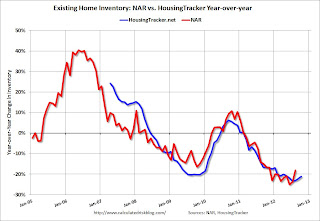 HousingTracker reported that the early October listings, for the 54 metro areas, declined 21.4% from the same period last year.
The year-over-year declines will probably start to get smaller since inventory is already pretty low. I doubt we will see 20% year-over-year declines next summer!


