 RSS Feed
 by Calculated Risk on 7/18/2012 10:41:00 AM
Wednesday, July 18, 2012
AIA: Architecture Billings Index shows "drop in design activity" in June
Note: This index is a leading indicator primarily for new Commercial Real Estate (CRE) investment.
From AIA: Weak Market Conditions Persist According to Architecture Billings Index
The Architecture Billings Index (ABI) saw more poor conditions last month, indicating a drop in design activity at U.S. architecture firms, and suggesting upcoming weakness in spending on nonresidential construction projects. As a leading economic indicator of construction activity, the ABI reflects the approximate nine to twelve month lag time between architecture billings and construction spending. The American Institute of Architects (AIA) reported the June ABI score was 45.9, nearly identical to the mark of 45.8 in May. This score reflects a decrease in demand for design services (any score above 50 indicates an increase in billings). The new projects inquiry index was 54.4, up slightly from mark of 54.0 the previous month.
“The downturn in design activity that began in April and accelerated in May has continued into June, likely extending the weak market conditions we’ve seen in nonresidential building activity ,” said AIA Chief Economist, Kermit Baker, PhD, Hon. AIA. “While not all firms are experiencing negative conditions, a large share is still coping with a sluggish and erratic marketplace.”
 Click on graph for larger image.
This graph shows the Architecture Billings Index since 1996. The index was at 45.9 in June, up slightly from May. Anything below 50 indicates contraction in demand for architects' services.
Note: This includes commercial and industrial facilities like hotels and office buildings, multi-family residential, as well as schools, hospitals and other institutions.
According to the AIA, there is an "approximate nine to twelve month lag time between architecture billings and construction spending" on non-residential construction. This suggests further weakness in CRE investment later this year and into next year (it will be some time before investment in offices and malls increases).
Housing Starts increased to 760 thousand in June, Highest since October 2008
by Calculated Risk on 7/18/2012 08:30:00 AM
From the Census Bureau: Permits, Starts and Completions
Housing Starts:
Privately-owned housing starts in June were at a seasonally adjusted annual rate of 760,000. This is 6.9 percent above the revised May estimate of 711,000 and is 23.6 percent above the June 2011 rate of 615,000.
Single-family housing starts in June were at a rate of 539,000; this is 4.7 percent above the revised May figure of 515,000. The June rate for units in buildings with five units or more was 213,000.
Building Permits:
Privately-owned housing units authorized by building permits in June were at a seasonally adjusted annual rate of 755,000. This is 3.7 percent below the revised May rate of 784,000, but is 19.3 percent above the June 2011 estimate of 633,000.
Single-family authorizations in June were at a rate of 493,000; this is 0.6 percent above the revised May figure of 490,000. Authorizations of units in buildings with five units or more were at a rate of 241,000 in June.
 Click on graph for larger image.
Total housing starts were at 760 thousand (SAAR) in June, up 6.9% from the revised May rate of 711 thousand (SAAR). Note that May was revised up from 708 thousand. April was revised up slightly too.
Single-family starts increased 4.7% to 539 thousand in June.
The second graph shows total and single unit starts since 1968.
 This shows the huge collapse following the housing bubble, and that total housing starts have been increasing lately after moving sideways for about two years and a half years.
 Total starts are up 59% from the bottom start rate, and single family starts are up 53% from the low.
This was above expectations of 745 thousand starts in June. This is another fairly strong housing report.
MBA: "Record Low Mortgage Rates Lead to Jump in Refinance Activity"
by Calculated Risk on 7/18/2012 07:04:00 AM
From the MBA: Record Low Mortgage Rates Lead to Jump in Refinance Activity
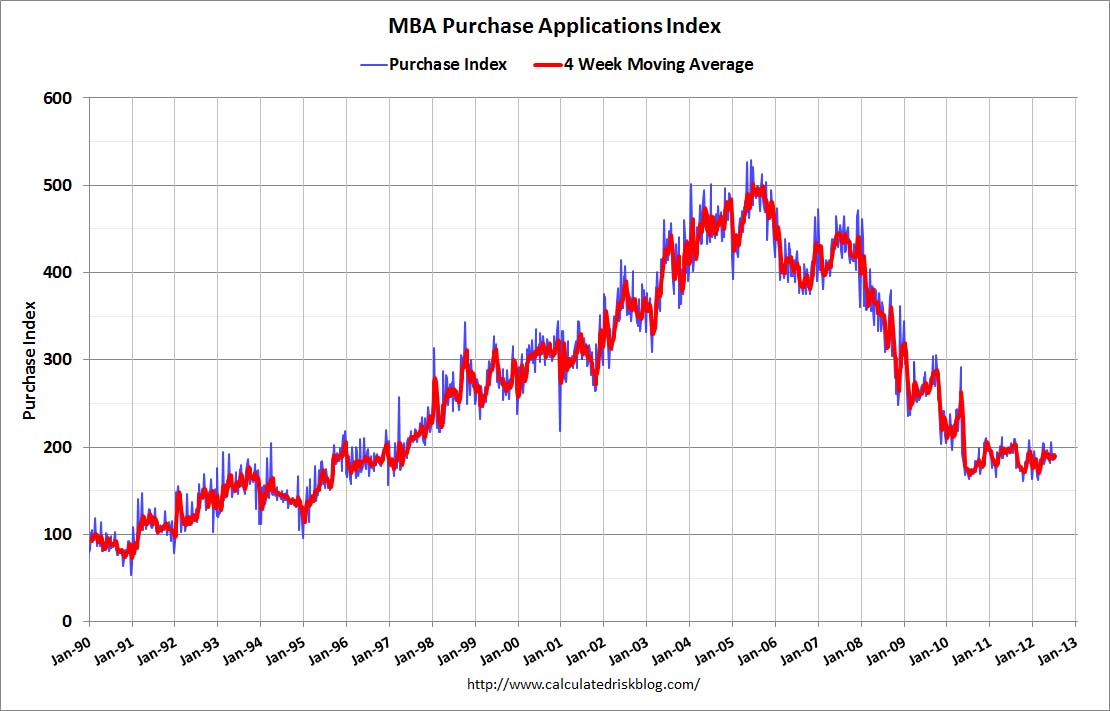
The Refinance Index increased 22 percent from the previous week and is at the highest level since mid-June. The seasonally adjusted Purchase Index decreased 0.1 percent from one week earlier.
“Refinance application volume increased last week to near peak levels for the year as mortgage rates dropped to a new low, driven down by growing concerns about the health of the US economy,” said Mike Fratantoni, MBA’s Vice President of Research and Economics. “Applications for HARP refinance loans accounted for 24 percent of refinance activity last week, in line with the HARP share for the past few weeks.”
The average contract interest rate for 30-year fixed-rate mortgages with conforming loan balances ($417,500 or less) decreased to 3.74 percent, the lowest rate in the history of the survey, from 3.79 percent, with points increasing to 0.45 from 0.36 (including the origination fee) for 80 percent loan-to-value ratio (LTV) loans.
 Click on graph for larger image.
The first graph shows the purchase index, and the purchase index is mostly moving sideways over the last two years - but has been moving a little recently.
The second graph shows the refinance index.
 This index is back to the high for the year.
Some of the increase in the refinance index is related to HARP (HARP activity has picked up this year), but most of this activity is related to the record low mortgage rates.
Tuesday, July 17, 2012
Wednesday: Housing Starts, Beige Book, more Bernanke
by Calculated Risk on 7/17/2012 10:01:00 PM
Wednesday will be another busy day for economic data, but first from Binyamin Appelbaum at the NY Times: Cautious on Growth, Bernanke Offers No Hint of New Action
The Federal Reserve chairman, Ben S. Bernanke, said Tuesday that the Fed was seeking greater clarity about the health of the recovery, suggesting that officials were not ready to approve another round of stimulus.• At 7:00 AM AM ET, the Mortgage Bankers Association (MBA) will release the mortgage purchase applications index.
...
Rather than committing to new steps, Mr. Bernanke told the Senate Banking Committee that the decision would turn on the judgment of Fed officials about the pace of job growth in the coming months.
The major issue, he said, is “whether or not there is in fact a sustained recovery going on in the labor market, or are we stuck in the mud?” Mr. Bernanke added a wrinkle, saying the central bank “would certainly want to react against any increase in deflation risk.”
• 8:30 AM: Housing Starts for June will be released. The consensus is for total housing starts to increase to 745,000 (SAAR) in June from 708,000 in May.
• At 10:00 AM, Fed Chairman Ben Bernanke will testify before the Committee on Financial Services, U.S. House of Representatives. (same report again).
• At 2:00 PM, the Federal Reserve Beige Book will be released.
Also during the day, the AIA's Architecture Billings Index for June will be released (a leading indicator for commercial real estate).
For the July contest:
Lawler: Early Read on Existing Home Sales in June
by Calculated Risk on 7/17/2012 06:29:00 PM
From economist Tom Lawler:
Based on an admittedly limited sample of realtor/MLS reports across the country, I estimate that existing home sale ran at a seasonally adjusted annual rate of 4.56 million in June, little changed from May’s SA pace and up 9.1% from last June’s SA pace. Unadjusted data clearly show a smaller YOY gain in June sales relative to May sales, which was expected, as this May had one more business day than last May, while this June had one fewer business day than last May.CR Note: This would put the months-of-supply at about 6.6 months, unchanged from May. For the month of June, this would be the lowest level of inventory since 2004, and the lowest months-of-supply since 2005. The NAR is scheduled to report June sales on Thursday.
It is worth noting that in several “distressed” markets, sales this June were down from a year ago, even though in many of these markets non-distressed (and especially non-foreclosure) sales, were up -- in some cases by a lot.
On the inventory front, various entities that track listings showed modestly different trends, though all show big YOY declines. Realtor.com, e.g., reported that the AVERAGE number of listings in the month of June was up 0.5% from May, but down 19.4% from last June, while HousingTracker.Net reported that average listings (actually, the average number of listings on Mondays) in June in the 54 metro markets it tracks were down 1.3% from May and down 22.0% from last June. Looking at these data, combined with realtor reports, my “best guess” is that the NAR’s estimate for the number of existing homes for sale at the end of June will be about 2.5 million, up 0.4% from May but down 20.9% from last June.
On the median sales price front, it’s pretty clear that the national median existing SF sales price this June will show another YOY gain – the fourth in a row – though local realtor/MLS data suggest that June’s YOY increase will be a bit less than May’s. My best guess is that the NAR’s estimate of the median existing SF home sales price in June will be up about 6.4% from last June.
Tom also sent me the following updated table on distressed sales. From Lawler: "Note that all of these shares are based on MLS data or realtor reports save for those for Southern California, which come from Dataquick and are based on property records."
CR Note: Notice the decline in distressed sales. Foreclosure are down in all these areas, and short sales are up in most.
| Short Sales Share | Foreclosure Sales Share | Total "Distressed" Share | ||||
|---|---|---|---|---|---|---|
| 12-June | 11-June | 12-June | 11-June | 12-June | 11-June | |
| Las Vegas | 34.2% | 21.6% | 27.8% | 47.2% | 62.0% | 68.8% |
| Reno | 37.0% | 25.0% | 21.0% | 41.0% | 58.0% | 66.0% |
| Phoenix | 32.8% | 27.0% | 14.1% | 40.8% | 46.8% | 67.8% |
| Sacramento | 31.0% | 22.2% | 23.2% | 43.0% | 54.2% | 65.2% |
| Mid-Atlantic (MRIS) | 10.2% | 10.0% | 8.7% | 14.9% | 18.9% | 24.9% |
| Minneapolis | 9.6% | 10.5% | 25.1% | 33.9% | 34.6% | 44.3% |
| Southern California | 17.7% | 17.9% | 24.5% | 32.9% | 42.2% | 50.8% |
| Northeast Florida | 36.3% | 43.2% | ||||
| Hampton Roads | 28.8% | 29.7% | ||||
| Chicago | 33.5% | 36.0% | ||||
| Charlotte | 14.2% | 30.6% | ||||
And from DataQuick on SoCal:
The number of homes sold in Southern California rose above a year earlier for the sixth month in a row in June, the result of robust investor demand and significant sales gains for mid- to high-end homes.
Foreclosure resales – properties foreclosed on in the prior 12 months – accounted for 24.5 percent of the Southland resale market last month, down from a revised 26.9 percent the month before and 32.9 percent a year earlier. Last month’s figure was the lowest since foreclosure resales were 24.3 percent of the resale market in December 2007. In the current cycle, the figure hit a high of 56.7 percent in February 2009.
Short sales – transactions where the sale price fell short of what was owed on the property – made up an estimated 17.7 percent of Southland resales last month. That was down slightly from an estimated 18.0 percent the month before and 17.9 percent a year earlier.


