by Calculated Risk on 2/01/2012 07:21:00 PM
Wednesday, February 01, 2012
Q4 2011 GDP Details: Investment in Office, Mall, and Lodging, Residential Components
The BEA released the underlying details this week for the Q4 Advance GDP report. As expected, the recent pickup in non-residential structure investment has been for power and communication.
The first graph shows investment in offices, malls and lodging as a percent of GDP. Office investment as a percent of GDP peaked at 0.46% in Q1 2008 and then declined sharply. Investment has increased a little recently (probably mostly tenant improvements as opposed to new office buildings).
 Click on graph for larger image.
Investment in multimerchandise shopping structures (malls) peaked in 2007 and is down about 62% from the peak (note that investment includes remodels, so this will not fall to zero).
Lodging investment peaked at 0.32% of GDP in Q2 2008 and has fallen by about 80%.
Notice that investment for all three categories typically falls for a year or two after the end of a recession, and then usually recovers very slowly (flat as a percent of GDP for 2 or 3 years). This is happening again, and there will not be a recovery in these categories until the vacancy rates fall significantly.
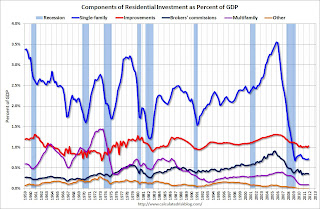
 The second graph is for Residential investment (RI) components as a percent of GDP. According to the Bureau of Economic Analysis, RI includes new single family structures, multifamily structures, home improvement, broker's commissions, and a few minor categories (dormitories, manufactured homes).
Usually the most important components are investment in single family structures followed by home improvement.
Investment in single family structures has been moving sideways for almost three years, although it might be moving up a little.
Investment in home improvement was at a $158 billion Seasonally Adjusted Annual Rate (SAAR) in Q4 (about 1.0% of GDP), significantly above the level of investment in single family structures of $109 billion (SAAR) (or 0.7% of GDP).
Brokers' commissions declined slightly in Q4, and has been moving sideways as a percent of GDP.
And investment in multifamily structures is still moving sideways as a percent of GDP (increasing slowly in dollars). This is a small category, and even though investment is increasing, the positive impact on GDP will be relatively small.
These graphs show there is currently very little investment in offices, malls and lodging. It appears that residential investment is starting to pickup, but from a very low level.
Earlier:
• ADP: Private Employment increased 170,000 in January
• Construction Spending increased 1.5% in December
• ISM Manufacturing index indicates faster expansion in January
• U.S. Light Vehicle Sales at 14.18 million annual rate in January
U.S. Light Vehicle Sales at 14.18 million annual rate in January
by Calculated Risk on 2/01/2012 03:50:00 PM
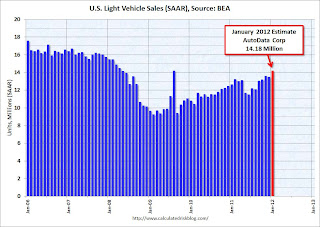
Based on an estimate from Autodata Corp, light vehicle sales were at a 14.18 million SAAR in January. That is up 12.1% from January 2011, and up 5.1% from the sales rate last month (13.5 million SAAR in Dec 2011).
This was well above the consensus forecast of 13.6 million SAAR.
This graph shows the historical light vehicle sales (seasonally adjusted annual rate) from the BEA (blue) and an estimate for December (red, light vehicle sales of 14.18 million SAAR from Autodata Corp).
 Click on graph for larger image.
The annualized sales rate was up sharply from December, and this was about the same level as August 2009 with the spike in sales from "cash-for-clunkers". Excluding cash-for-clunkers this was the strongest sales month since April 2008.
The second graph shows light vehicle sales since the BEA started keeping data in 1967.
This shows the huge collapse in sales in the 2007 recession. This also shows the impact of the tsunami and supply chain issues on sales, especially in May and June.
 Note: dashed line is current estimated sales rate.
Growth in auto sales will probably make another strong positive contribution GDP in Q1 2012 GDP, although not as strong as in Q4 2011.
Another strong gain for auto sales.
Misc: REO to Rental Program, New Refinance Plan and Auto Sales
by Calculated Risk on 2/01/2012 01:20:00 PM
From the FHFA: FHFA Announces Interested Investors May Pre-Qualify For REO Initiative
The Federal Housing Finance Agency (FHFA) today announced the first step of a Real Estate Owned (REO) Initiative targeted to hardest-hit metropolitan areas announced in August 2011. Investors interested in participating may “pre-qualify” to establish eligibility to bid on transactions in the initial pilot phase as well as subsequent phases.From the WSJ: Obama Announces Refinancing Plan
...
During the pilot phase, Fannie Mae will offer for sale pools of various types of assets including rental properties, vacant properties and non-performing loans with a focus on the hardest-hit areas. The first transaction will be announced in the near-term.
...
FHFA is also looking at ways to improve REO sales to homeowners and small investors, enhancing the existing retail sales strategy at Fannie Mae and Freddie Mac. Both companies sell the majority of their REO properties to owner-occupants at close to market value.
The centerpiece of the announcement was the refinancing push, which complements an existing program that makes it easier for homeowners with mortgages backed by Fannie Mae and Freddie Mac to refinance.This would replace non-GSE loans with FHA insured loans. Since it requires congressional approval, it probably will not happen.
The new initiative would extend that opportunity to roughly one-third of all mortgages that aren't backed by federal entities and instead are owned by banks or were bundled by private firms that sold them off to investors as mortgage-backed securities. The Federal Housing Administration would instead guarantee the new loan.
To qualify, homeowners would have to be current on their last six mortgage payments and have no more than one delinquency in the previous six months.
And from the WSJ: January U.S. Auto Sales Jump
Chrysler Group LLC led the way as its January U.S. sales leapt 44% to 101,149 cars and light trucks while ... GM's January sales fell 6%, reflecting deep discounts and new models that fueled sales gains a year ago. ... Ford Motor Co. also said its U.S. sales rose 7.3% to 136,294 cars and light trucks.I'll post a graph after all the data is released - usually around 4 PM ET - of the seasonally adjusted annual sales rate for January.
Earlier:
• ADP: Private Employment increased 170,000 in January
• Construction Spending increased 1.5% in December
• ISM Manufacturing index indicates faster expansion in January
Construction Spending increased 1.5% in December
by Calculated Risk on 2/01/2012 11:32:00 AM
Catching up ... This morning the Census Bureau reported that overall construction spending increased in December:
The U.S. Census Bureau of the Department of Commerce announced today that construction spending during December 2011 was estimated at a seasonally adjusted annual rate of $816.4 billion, 1.5 percent (±1.4%) above the revised November estimate of $804.0 billion. The December figure is 4.3 percent (±1.9%) above the December 2010 estimate of $782.9 billion.Private construction spending increased in December:
The value of construction in 2011 was $787.4 billion, 2.0 percent (±1.1%) below the $803.6 billion spent in 2010.
Spending on private construction was at a seasonally adjusted annual rate of $529.7 billion, 2.1 percent (±1.1%) above the revised November estimate of $518.8 billion. Residential construction was at a seasonally adjusted annual rate of $241.2 billion in December, 0.8 percent (±1.3%)* above the revised November estimate of $239.4 billion. Nonresidential construction was at a seasonally adjusted annual rate of $288.5 billion in December, 3.3 percent (±1.1%) above the revised November estimate of $279.4 billion.
 Click on graph for larger image.
This graph shows private residential and nonresidential construction spending, and public spending, since 1993. Note: nominal dollars, not inflation adjusted.
Private residential spending is 64% below the peak in early 2006, and non-residential spending is 30% below the peak in January 2008.
Public construction spending is now 11% below the peak in March 2009.
 The second graph shows the year-over-year change in construction spending.
On a year-over-year basis, both private residential and non-residential construction spending have turned positive, but public spending is down on a year-over-year basis as the stimulus spending ends. The year-over-year improvements in private non-residential are mostly due to energy spending (power and electric).
The year-over-year improvement in private residential investment is an important change (the positive in 2010 was related to the tax credit).
Earlier:
• ISM Manufacturing index indicates faster expansion in January
ISM Manufacturing index indicates faster expansion in January
by Calculated Risk on 2/01/2012 10:00:00 AM
PMI was at 54.1% in January, up from a revised 53.1% in December. The employment index was at 54.3%, down from a revised 54.8%, and new orders index was at 57.6%, up from a revised 54.8%.
From the Institute for Supply Management: January 2012 Manufacturing ISM Report On Business®
Economic activity in the manufacturing sector expanded in January for the 30th consecutive month, and the overall economy grew for the 32nd consecutive month, say the nation's supply executives in the latest Manufacturing ISM Report On Business®.
The report was issued today by Bradley J. Holcomb, CPSM, CPSD, chair of the Institute for Supply Management™ Manufacturing Business Survey Committee. "The PMI registered 54.1 percent, an increase of 1 percentage point from December's seasonally adjusted reading of 53.1 percent, indicating expansion in the manufacturing sector for the 30th consecutive month. The New Orders Index increased 2.8 percentage points from December's seasonally adjusted reading to 57.6 percent, reflecting the 33rd consecutive month of growth in new orders. Prices of raw materials increased for the first time in the last four months. Manufacturing is starting out the year on a positive note, with new orders, production and employment all growing in January."
 Click on graph for larger image.
Here is a long term graph of the ISM manufacturing index.
This was below expectations of 54.5%, but the consensus was before the revisions. This suggests manufacturing expanded at a faster rate in January than in December. It appears manufacturing employment expanded in January with the employment index at 54.3%.
On revisions: Yesterday the ISM released their annual revisions and addressed the seasonality issue that was raised by analysts at Nomura last year. It appears the ISM index (and other indexes) overstated the strength in December after understating the strength earlier in the year. Nomura analysts noted last night that they believe the ISM revision reduces, but does not eliminate, the seasonal adjustment bias due to the financial crisis.


