by Calculated Risk on 12/23/2011 03:47:00 PM
Friday, December 23, 2011
Mortgage Settlement Update: Some details, Deal to be announced in January "at the earliest"
There are a quite a few details in this article by Massimo Calabresi at TIME: Details of Mortgage Servicing Settlement Between Banks and AGs Begin to Emerge
... the banks will commit to three categories of the settlement: $5 billion in cash payments, mostly to the states, $3 billion in refinancing for underwater mortgages, and $17 billion in principal reduction.There are many more details in the article.
...
Of the $5 billion, $1.5 billion will go to people who have been foreclosed on and were abused in some way during the process. The claims are nearly instantaneous ... the payments are also small: $1,500 to $2,000. ... no one taking the payment would be giving up any rights to bring cases against the banks for wrongful eviction or other claims they may have.
...
The bulk of the money—$17 billion—would go to principal reduction for homeowners and a menu of other elements ...
In return for the $5 billion in cash and the $20 billion in credits, the banks would be released from claims against them for servicing and foreclosure abuses that might be brought against them by the states and the federal government. The states also release the banks from origination claims ... The banks do not get immunity or a release of for individual claims by homeowners ... They also don’t get released for securitization abuses ...
According to the article, the details will be announced in January at the earliest.
Home Sales: Distressing Gap
by Calculated Risk on 12/23/2011 12:12:00 PM
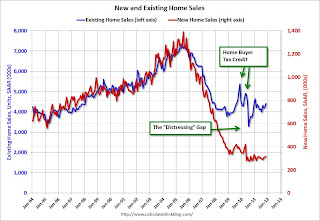
Here is the first "distressing gap" graph after the benchmark revision for existing home sales. Even with the significant downward revisions to existing home sales for the years 2007 through 2011, most of the distressing gap remains.
The following graph shows existing home sales (left axis) and new home sales (right axis) through November. This graph starts in 1994, but the relationship has been fairly steady back to the '60s.
Following the housing bubble and bust, the "distressing gap" appeared mostly because of distressed sales. The flood of distressed sales has kept existing home sales elevated, and depressed new home sales since builders can't compete with the low prices of all the foreclosed properties.
 Click on graph for larger image.
I expect this gap to eventually close once the number of distressed sales starts to decline.
Note: Existing home sales are counted when transactions are closed, and new home sales are counted when contracts are signed. So the timing of sales is different.
On November Home Sales:
• New Home Sales increase in November to 315,000 SAAR
• New Home Sales graphs
Earlier in the week on Existing Home sales:
• Existing Home Sales in November: 4.42 million SAAR, 7.0 months of supply
• Existing Home Sales Revisions
• Existing Home Sales graphs
New Home Sales increase in November to 315,000 SAAR
by Calculated Risk on 12/23/2011 10:00:00 AM
The Census Bureau reports New Home Sales in November were at a seasonally adjusted annual rate (SAAR) of 315 thousand. This was up from a revised 310 thousand in October (revised up from 307 thousand).
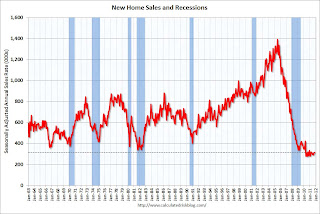
The first graph shows New Home Sales vs. recessions since 1963. The dashed line is the current sales rate.
Sales of new single-family houses in November 2011 were at a seasonally adjusted annual rate of 315,000 ... This is 1.6 percent (±12.2%)* above the revised October rate of 310,000 and is 9.8 percent (±19.5%)* above the November 2010 estimate of 287,000.
 Click on graph for larger image in graph gallery.
The second graph shows New Home Months of Supply.
Months of supply decreased to 6.0 in November.
The all time record was 12.1 months of supply in January 2009.
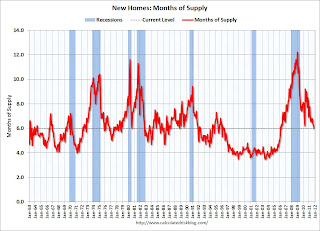 This is now close to normal (less than 6 months supply is normal).
The seasonally adjusted estimate of new houses for sale at the end of November was 158,000. This represents a supply of 6.0 months at the current sales rate.On inventory, according to the Census Bureau:
"A house is considered for sale when a permit to build has been issued in permit-issuing places or work has begun on the footings or foundation in nonpermit areas and a sales contract has not been signed nor a deposit accepted."Starting in 1973 the Census Bureau broke this down into three categories: Not Started, Under Construction, and Completed.
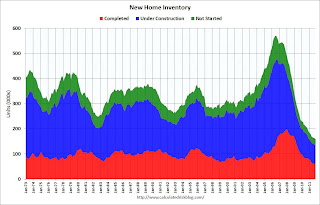 This graph shows the three categories of inventory starting in 1973.
The inventory of completed homes for sale was at 59,000 units in November. The combined total of completed and under construction is at the lowest level since this series started.
The last graph shows sales NSA (monthly sales, not seasonally adjusted annual rate).
In November 2011 (red column), 22 thousand new homes were sold (NSA). This was the second weakest November since this data has been tracked, and was just above the record low for November of 20 thousand set in 2010. The high for November was 86 thousand in 2005.
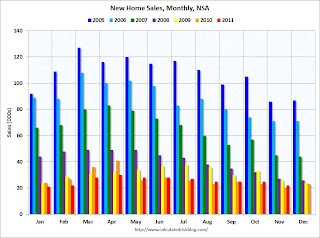 This was slightly above the consensus forecast of 313 thousand, and just above the record low for the month of November set last year (NSA).
 New home sales have averaged only 300 thousand SAAR over the 19 months since the expiration of the tax credit ... mostly moving sideways at a very low level ... although sales have been increasing a little lately.
Personal Income increased 0.1% in November, Spending increased 0.1%
by Calculated Risk on 12/23/2011 08:30:00 AM
The BEA released the Personal Income and Outlays report for November:
Personal income increased $8.5 billion, or 0.1 percent ... in November, according to the Bureau of Economic Analysis. Personal consumption expenditures (PCE) increased $13.1 billion, or 0.1 percent in November.The following graph shows real Personal Consumption Expenditures (PCE) through November (2005 dollars). Note that the y-axis doesn't start at zero to better show the change.
...
Real PCE -- PCE adjusted to remove price changes -- increased 0.2 percent in November ... The price index for PCE decreased less than 0.1 percent in November, compared with a decrease of 0.1 percent in October. The PCE price index, excluding food and energy, increased 0.1 percent in November
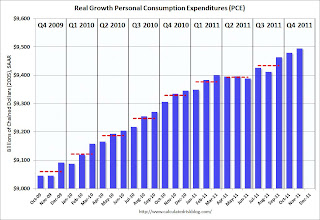 Click on graph for larger image.
PCE increased 0.1% in November, and real PCE increased 0.2%.
Note: The PCE price index, excluding food and energy, increased 0.1 percent.
The personal saving rate was at 3.5% in November.
Both personal income and spending were lower than expectations. Using the "two month" method to forecast real Q4 PCE growth suggests an increase of about 2.9% in Q4 - the strongest quarter this year.
Thursday, December 22, 2011
Reports: Fed could signal near zero rates into 2014, House ready to pass payroll tax cut extension
by Calculated Risk on 12/22/2011 05:34:00 PM
From Luca Di Leo and Jon Hilsenrath at the WSJ: Fed Could Keep Rates Near Zero Into 2014
The Federal Reserve could signal it is likely to keep short-term interest rates near zero into 2014 or beyond ... When the Fed revises its communications approach, there is a good chance it will cease offering a fixed date for the timing of rate increases. Instead, officials could signal their intentions by publishing a range of their forecasts for rates along with their quarterly economic projections.This change in communication strategy will probably happen at the two day January FOMC meeting on the 24th and 25th. If so, the sentence in the FOMC statement - "The Committee ... currently anticipates that economic conditions ... are likely to warrant exceptionally low levels for the federal funds rate at least through mid-2013." would be replaced with the forecast of future rates.
From the WaPo: House GOP agrees to 2-month extension of payroll tax cut
[T]op House Republicans have agreed to extend the payroll tax cut for 160 million Americans for two months, according to Democratic and Republican congressional aides. As part of the deal, Senate leaders will appoint a conference committee to negotiate a full-year tax cut after Jan. 1.It was just a matter of when ...
...
The measure also extends unemployment benefits for two months and averts a cut in the reimbursement rate for doctors who treat Medicare patients.


