by Calculated Risk on 11/24/2010 10:24:00 PM
Wednesday, November 24, 2010
ATA: Truck Tonnage Index increases in October
by Calculated Risk on 11/24/2010 07:15:00 PM
Earlier post: New Home Sales decline in October
From the American Trucking Association: ATA Truck Tonnage Index Rose 0.8 Percent in October
The American Trucking Associations’ advance seasonally adjusted (SA) For-Hire Truck Tonnage Index rose 0.8 percent in October after increasing a revised 1.8 percent in September. The latest gain put the SA index at 109.7 (2000=100) in October from 108.9 in September.
...
ATA Chief Economist Bob Costello said that truck tonnage changes over the last couple months shows there are some bright spots in the U.S. economy. “October tonnage levels were at the highest level in three months, even after accounting for typical seasonal shipping patterns. These gains fit with reports out of both the manufacturing and retail sectors and show there is a little bit of life in this economic recovery."
 Click on map for larger image.
This graph from the ATA shows the Truck Tonnage Index since Jan 2006.
The line is added to show the index has been mostly moving sideways this year.
Comments on October Personal Income and Outlays Report
by Calculated Risk on 11/24/2010 03:28:00 PM
The BEA released the Personal Income and Outlays report for October this morning.
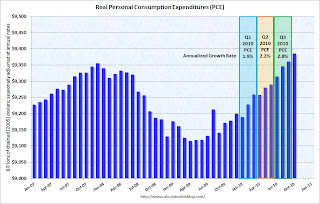
Personal income increased $57.6 billion, or 0.5 percent ... Personal consumption expenditures (PCE) increased $44.0 billion, or 0.4 percent.The following graph shows real Personal Consumption Expenditures (PCE) through October (2005 dollars). Note that the y-axis doesn't start at zero to better show the change.
...
Real PCE -- PCE adjusted to remove price changes -- increased 0.3 percent in October, compared with an increaseof 0.2 percent in September.
 Click on graph for large image.
The quarterly change in PCE is based on the change from the average in one quarter, compared to the average of the preceding quarter.
Even with no growth in November and December, PCE growth will be close to 2% in Q4, and it will probably be closer to 3% (annualized growth rate).
Also personal income less transfer payments increased sharply in October. This increased to $9,285.7 billion (SAAR, 2005 dollars) from $9,252.2 billion in September. This measure had stalled out over the summer.
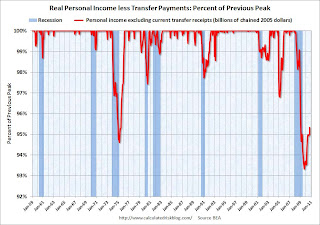 This graph shows real personal income less transfer payments as a percent of the previous peak. This has been slow to recover - and is still 4.7% below the previous peak - but is recovering again.
 Overall this was a fairly positive report, in line with consensus expectations, and suggests decent (but not robust) growth in October.
Europe Update: Irish Austerity, New Resolution Mechanism, Rising Yields
by Calculated Risk on 11/24/2010 12:43:00 PM
From the Irish Times: 'No group sheltered' as €15 billion savings plan unveiled
[S]pending on social welfare cut by €2.8 billion primarily through cuts in unemployment benefits and child income supports ... new levies on property and a hike in the basic rate of income tax ...And the WSJ reports obtaining a copy of Germany's proposal for a permanent resolution mechanism that would take effect after the EFSF expires in 2013. According to the WSJ, the proposal would create a
"permanent, intergovernmental crisis-management mechanism" in which euro-zone members, private investors and the International Monetary Fund would all play a role.This is the widely discussed "haircut" for bondholders.
Spanish 10-year bond yields have pushed above 5%, the Portugal 10-year yield is at 7%, and Ireland is up to 8.89%.
Note: Right now this is a European problem and I see little impact on the U.S. in the short term.
New Home Sales decline in October
by Calculated Risk on 11/24/2010 10:00:00 AM
The Census Bureau reports New Home Sales in October were at a seasonally adjusted annual rate (SAAR) of 283 thousand. This is down from 308 thousand in September.
 Click on graph for larger image in new window.
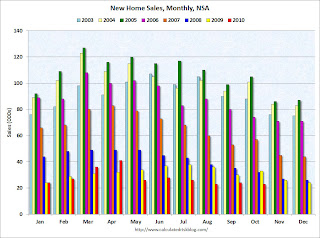
The first graph shows monthly new home sales (NSA - Not Seasonally Adjusted or annualized).
Note the Red columns for 2010. In October 2010, 23 thousand new homes were sold (NSA). This is a new record low for October.
The previous record low for the month of October was 29 thousand in 1981; the record high was 105 thousand in October 2005.
 The second graph shows New Home Sales vs. recessions for the last 47 years. The dashed line is the current sales rate.
Sales of new single-family houses in October 2010 were at a seasonally adjusted annual rate of 283,000, according to estimates released jointly today by the U.S. Census Bureau and the Department of Housing and Urban Development. This is 8.1 percent (±16.1%)* below the revised September rate of 308,000 and is 28.5 percent (±12.6%) below the October 2009 estimate of 396,000.And another long term graph - this one for New Home Months of Supply.
 Months of supply increased to 8.6 in October from 7.9 in September. The all time record was 12.4 months of supply in January 2009. This is still high (less than 6 months supply is normal).
The seasonally adjusted estimate of new houses for sale at the end of October was 202,000. This represents a supply of 8.6 months at the current sales rate.
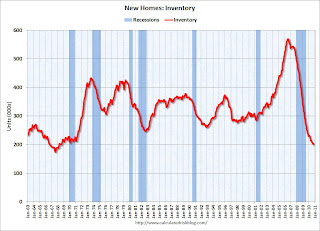 The final graph shows new home inventory.
 The 283 thousand annual sales rate for October is just above the all time record low in August (275 thousand). This was the weakest October on record and well below the consensus forecast of 314 thousand.
This was another very weak report.
Weekly Initial Unemployment Claims decrease sharply
by Calculated Risk on 11/24/2010 08:30:00 AM
The DOL reports on weekly unemployment insurance claims:
In the week ending Nov. 20, the advance figure for seasonally adjusted initial claims was 407,000, a decrease of 34,000 from the previous week's revised figure of 441,000. The 4-week moving average was 436,000, a decrease of 7,500 from the previous week's revised average of 443,500.
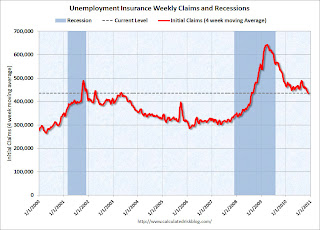 Click on graph for larger image in new window.
This graph shows the 4-week moving average of weekly claims since January 2000.
The dashed line on the graph is the current 4-week average. The four-week average of weekly unemployment claims decreased this week by 7,500 to 436,000.
This is the lowest level for the 4-week moving average since August 2008. This decline is good news.


