 RSS Feed
 by Calculated Risk on 9/30/2010 11:49:00 PM
Thursday, September 30, 2010
Video: Economist / Comedian Bauman at the American Economic Association humor session
A little economics humor ...
Hotel Occupancy Rate: Slightly below 2008 Levels
by Calculated Risk on 9/30/2010 09:04:00 PM
Hotel occupancy is one of several industry specific indicators I follow ...
From HotelNewsNow.com: STR: Chain scales report strong RevPAR gains
Overall, the U.S. hotel industry rose 7.5% in occupancy to 64.2%, average daily rate was up 2.6% to US$103.09, and RevPAR ended the week up 10.3% to US$66.15.The following graph shows the four week moving average for the occupancy rate by week for 2008, 2009 and 2010 (and a median for 2000 through 2007).
 Click on graph for larger image in new window.
Notes: the scale doesn't start at zero to better show the change. The graph shows the 4-week average, not the weekly occupancy rate.
On a 4-week basis, occupancy is up 6.0% compared to last year (the worst year since the Great Depression) and 5.2% below the median for 2000 through 2007.
The occupancy rate is slightly below the levels of 2008 - and 2008 was a tough year for the hotel industry!
Important: Even though the occupancy rate is close to 2008 levels, 2010 is a much more difficult year. The average daily rate (ADR) is off close to 8% from 2008 levels - so even with the similar occupancy rates, hotel room revenue is off sharply compared to two years ago.
Data Source: Smith Travel Research, Courtesy of HotelNewsNow.com
Existing Home Inventory declines slightly in September, Up year-over-year
by Calculated Risk on 9/30/2010 06:00:00 PM
Tom Lawler reports that at the end of September, listings on Realtor.com totaled 3,960,417, down 1.2% from 4,007,860 at the end of August. This is 1.7% higher than in September 2009.
The NAR reported inventory at 3.98 million at the end of August, and at 3.71 million in September 2009. So they will probably report inventory at around 3.85 million for September 2010. (NAR does not seasonally adjust inventory and this appears to be a normal seasonal decline. The months-of-supply metric uses seasonally adjusted sales, but NSA inventory.).
Since sales probably only increased slightly in September, the months-of-supply metric will probably still be well into double digits again.
Note: there is a seasonal pattern for existing home inventory. Usually inventory peaks in July and declines slightly through October - and then declines sharply at the end of the year as sellers take their homes off the market for the holidays.
Restaurant Index shows contraction in August
by Calculated Risk on 9/30/2010 03:31:00 PM
This is one of several industry specific indexes I track each month.
 Click on graph for larger image in new window.
Same store sales and customer traffic both declined again in August (on a year-over-year basis). Unfortunately the data for this index only goes back to 2002.
Note: Any reading above 100 shows expansion for this index.
From the National Restaurant Association (NRA): Restaurant Industry Outlook Remained Cautious as Restaurant Performance Index Was Essentially Flat in August
As a result of continued soft sales and traffic levels, the National Restaurant Association’s comprehensive index of restaurant activity remained below 100 for the fourth consecutive month in August. The Association’s Restaurant Performance Index (RPI) – a monthly composite index that tracks the health of and outlook for the U.S. restaurant industry – stood at 99.5 in August, essentially unchanged from the previous three months. In addition, the RPI stood below 100 for the fourth consecutive month, which signifies contraction in the index of key industry indicators.Restaurants are a discretionary expense, and this contraction could be because of the sluggish recovery or might suggest further weakness in consumer spending in the months ahead.
...
Restaurant operators reported a net decline in same-store sales for the fifth consecutive month in August ... Restaurant operators also continued to report a net decline in customer traffic levels in August..
emphasis added
The Economist: Expanding household Size
by Calculated Risk on 9/30/2010 01:34:00 PM
From The Economist: Cramped quarters: As children postpone their departure, households get larger
 Image credit: The Economist
[A]fter shrinking for decades, households have started to grow. Last year the average household had 2.59 people, up from 2.56 two years earlier, marking the first increase since 1993.Note: This data comes from the 2009 American Community Survey, and many caveats apply.
...
Much of this is almost certainly a response to the recession and the surge in unemployment. For young people who have lost their job or cannot find their first one, living with their parents becomes more attractive.
As Greg Ip noted, the overall U.S. population is still growing, and at the current growth rate that would usually mean the demand for over 1 million additional housing units per year. However since many people are doubling up (or as we always joke - have moved into their parent's basement), this keeps the demand for housing units down.
This might seem like a small increase in the number of people per household (from 2.56 to 2.59), however that has a significant impact on the number of housing units needed.
Some rough numbers: If we assume a population of 300 million, the slight increase in household size would suggest about 1.3 million fewer housing units were needed. (300 million divided 2.56) minus (300 million divided by 2.59) equals about 1.3 million. This is more than offset by the growing population over this two year period, but this shows why the excess inventory has remained very high even with a series low number of new housing units being completed.
We all expected this during the recession, but it will be important to watch if the household size starts to decline again.
Kansas City Fed: Regional Manufacturing Activity rebounded in September
by Calculated Risk on 9/30/2010 11:13:00 AM
Usually I don't post all the regional manufacturing surveys, but it appears manufacturing is slowing right now - and the regional surveys provide early clues ...
From the Kansas City Fed:
Tenth District manufacturing activity rebounded in September, and producers’ expectations for future activity also improved.Here is an update to the graph comparing the regional Fed surveys with the ISM manufacturing survey, including the Kansas City survey released this morning:
...
The net percentage of firms reporting month-over-month increases in production in September was 14, up from 0 in August and equal to 14 in July ... The shipments, new orders, and order backlog indexes jumped back into positive territory.
...
The employment index was unchanged [at -2].
 Click on graph for larger image in new window.
For this graph I averaged the New York and Philly Fed surveys (dashed green, through September), and averaged five surveys including New York, Philly, Richmond, Dallas and Kansas City (blue).
The Institute for Supply Management (ISM) PMI (red) is through August (right axis).
The ISM Manufacturing index will be released tomorrow and the consensus is for a decline to 54.5 in September from 56.3 in August.
Chicago PMI increases in September
by Calculated Risk on 9/30/2010 09:45:00 AM
From the Institute for Supply Management – Chicago:
The Chicago Purchasing Managers reported the CHICAGO BUSINESS BAROMETER improved in September to chalk up a full twelve months of expansion.The overall index increased to 60.4 vs. 56.7. Note: any number above 50 shows expansion.
Employment index declined to 53.4 from 55.5 in August.
The new orders index increased to 61.4 from 55.0.
Overall this was a positive report. The national ISM manufacturing index will be released tomorrow.
Weekly Initial Unemployment Claims decrease
by Calculated Risk on 9/30/2010 08:30:00 AM
The DOL reports on weekly unemployment insurance claims:
In the week ending Sept. 25, the advance figure for seasonally adjusted initial claims was 453,000, a decrease of 16,000 from the previous week's revised figure of 469,000. The 4-week moving average was 458,000, a decrease of 6,250 from the previous week's revised average of 464,250.
 Click on graph for larger image in new window.
This graph shows the 4-week moving average of weekly claims since January 2000.
The dashed line on the graph is the current 4-week average. The four-week average of weekly unemployment claims decreased this week by 6,250 to 458,000.
The 4-week moving average has been moving sideways at an elevated level for about 10 months - and that suggests a weak job market.
Wednesday, September 29, 2010
Two Stories: JPMorgan halts some foreclosures, Fed to release crisis transaction details
by Calculated Risk on 9/29/2010 09:26:00 PM
Here are two stories we've been discussing in the comments ...
From David Streitfeld at the NY Times: JPMorgan Suspending Foreclosures
JPMorgan Chase, said it was halting 56,000 foreclosures because some of its employees might have improperly signed court documents. All of the suspensions are in the 23 states where foreclosures must be approved by a court, including New York, New Jersey, Connecticut, Florida and Illinois.It is amazing that the servicers haven't reviewed all their procedures already ...
And from Fed Chairman Ben Bernanke: Regulatory Reform Implementation
A final element of the Federal Reserve's efforts to implement the Dodd-Frank Act relates to the transparency of our balance sheet and liquidity programs. Well before enactment, we were providing a great deal of relevant information on our website, in statistical releases, and in regular reports to the Congress. Under a framework established by the act, the Federal Reserve will, by December 1, provide detailed information regarding individual transactions conducted across a range of credit and liquidity programs over the period from December 1, 2007, to July 20, 2010. This information will include the names of counterparties, the date and dollar value of individual transactions, the terms of repayment, and other relevant information. On an ongoing basis, subject to lags specified by the Congress to protect the efficacy of the programs, the Federal Reserve also will routinely provide information regarding the identities of counterparties, amounts financed or purchased and collateral pledged for transactions under the discount window, open market operations, and emergency lending facilities.Apparently disclosure isn't a problem now.
Fannie Mae and Freddie Mac: Serious Delinquent Rates decline
by Calculated Risk on 9/29/2010 05:01:00 PM

Click on graph for larger image in new window.
Fannie Mae reported today that the rate of serious delinquencies - at least 90 days behind - for conventional loans in its single-family guarantee business decreased to 4.82% in July, down from 4.99% in June - and up from 4.17% in July 2009.
"Includes seriously delinquent conventional single-family loans as a percent of the total number of conventional single-family loans."
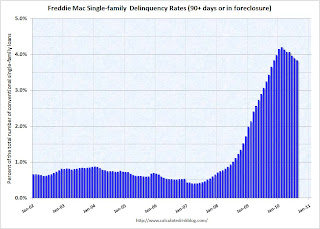 The second graph is for the delinquency rate for Freddie Mac. The rate declined to 3.83% in August (Freddie reports a month quicker than Fannie), from 3.89% in July.
Some of the rapid increase last year was probably because of foreclosure moratoriums, and distortions from modification programs because loans in trial mods were considered delinquent until the modifications were made permanent.
More modifications have become permanent and no longer counted as delinquent, and Fannie Mae and Freddie Mac are foreclosing again (they have a record number of REOs) - so there has been a decline in the delinquency rate.


