 RSS Feed
 by Calculated Risk on 8/18/2010 01:11:00 PM
Wednesday, August 18, 2010
Refinance Activity, Mortgage Rates and Effective Rate
The MBA reported this morning on the surge in refinance activity:
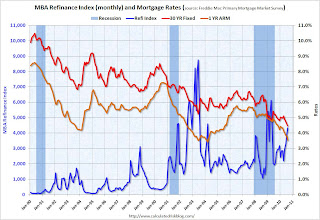
The Refinance Index increased 17.1 percent from the previous week and was the highest Refinance Index observed in the survey since the week ending May 15, 2009. ... The refinance share of mortgage activity increased to 81.4 percent of total applications from 78.1 percent the previous week, which is the highest refinance share observed since January 2009.
 Click on graph for larger image in new window.
The first graph shows the MBA's refinance index (monthly) and the the 30 year fixed rate mortgage interest rate and one year ARM rate, from the Freddie Mac Primary Mortgage Market Survey®.
As mortgage rates have fallen, there has been a surge in refinance activity. But it is still well below the activity during the 2009 refinance boom, or in 2002/2003. It takes lower and lower rates to get people to refi - and many borrowers have insufficient equity (or negative equity) or inadequate income to refi.
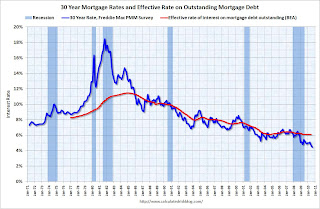 The second graph shows the 30 year fixed rate mortgage interest rate from the Freddie Mac Primary Mortgage Market Survey®.
 The red line is a quarterly estimate from the BEA of the effective rate of interest on all outstanding mortgages (Owner- and Tenant-occupied residential housing through Q2 2010).
The effective rate on outstanding mortgages is at a series low of just over 6%, but the rate is moving down slowly since so many borrowers can't refinance because they do not qualify (either because the property value is too low or their incomes are insufficient).
Because of the difference between current mortgage rates and the effective rate, many people are pushing for programs to help unqualified borrowers to refinance. As an example, PIMCO's Bill Gross suggested
Mr. Gross said the U.S. could easily refinance every current mortgage borrower, who is paying a rate above 5%, with a loan backed by Fannie Mae, Freddie Mac, and the Federal Housing Administration, returning tens of billions in savings.This will not happen unless the private lenders write down the principal - and that is very unlikely.
AIA: Architecture Billings Index shows contraction in July
by Calculated Risk on 8/18/2010 09:36:00 AM
Note: This index is a leading indicator for new Commercial Real Estate (CRE) investment.
The Business Times reports that the American Institute of Architects’ Architecture Billings Index increased to 47.9 in July from 46 in June. Any reading below 50 indicates contraction.
'We continue to receive a mixed bag of feedback on the condition of the design market, from improving to flat to being paralysed by uncertainty,' said AIA Chief Economist Kermit Baker.The ABI press release is not online yet.
 Click on graph for larger image in new window.
This graph shows the Architecture Billings Index since 1996. The index has remained below 50, indicating falling demand, since January 2008.
Note: Nonresidential construction includes commercial and industrial facilities like hotels and office buildings, as well as schools, hospitals and other institutions.
According to the AIA, there is an "approximate nine to twelve month lag time between architecture billings and construction spending" on non-residential construction. So there will probably be further declines in CRE investment into 2011.
MBA: Mortgage refinance activity increases sharply, Purchase activity declines
by Calculated Risk on 8/18/2010 07:17:00 AM
The MBA reports: Refinance Activity Increases to Highest Level Since May 2009 in Latest MBA Weekly Survey
The Refinance Index increased 17.1 percent from the previous week and was the highest Refinance Index observed in the survey since the week ending May 15, 2009. The seasonally adjusted Purchase Index decreased 3.4 percent from one week earlier.
...
The average contract interest rate for 30-year fixed-rate mortgages increased to 4.60 percent from 4.57 percent, with points increasing to 0.92 from 0.89 (including the origination fee) for 80 percent loan-to-value (LTV) ratio loans.
 Click on graph for larger image in new window.
This graph shows the MBA Purchase Index and four week moving average since 1990.
After falling sharply in May, the purchase index has been moving sideways for about three months. The index is 42% below the level of the last week of April (and about 32% below the last week of April using the 4-week average).
This recent collapse in the purchase index has already shown up as a decline in new home sales (counted when the contract is signed), and will show up in the July and August existing home sales report (July sales to be reported next week).
Tuesday, August 17, 2010
NY Fed: Total Household Debt down 6.4% from the peak in 2008
by Calculated Risk on 8/17/2010 10:46:00 PM
This is a new quarterly report from the NY Fed ...
From the NY Fed: New York Fed Releases New Report, Web Page on Household Credit Conditions in U.S., Select States Showing Decline in Consumer Indebtedness
The Federal Reserve Bank of New York today announced the release of a new Quarterly Report on Household Debt and Credit and an accompanying web page. The report shows that households steadily reduced aggregate consumer indebtedness over the past seven quarters. In the second quarter of 2010, they owed 6.4 percent less than they did in 2008, the peak year for indebtedness.Here is the report: Quarterly Report on Household Debt and Credit
Additionally, for the first time since early 2006, the share of total household debt in some stage of delinquency declined, from 11.9 percent to 11.2 percent. However, the number of people with a new bankruptcy noted on their credit reports rose 34 percent during the second quarter, considerably higher than the 20 percent increase typical of the second quarter in recent years.
...
The next quarterly reports are expected to be released on November 8, 2010, February 14, 2011, May 9, 2011 and August 8, 2011.
And some data and graphs.
 Click on graph for larger image in new window.
From the NY Fed:
Aggregate consumer debt continued to decline in the second quarter, continuing its trend of the previous six quarters. As of June 30, 2010, total consumer indebtedness was $11.7 trillion, a reduction of $812 billion (6.5%) from its peak level at the close of 2008Q3, and $178 billion (1.5%) below its March 31, 2010 level. Household mortgage indebtedness has declined 6.4%, and home equity lines of credit (HELOCs) have fallen 4.4% since their respective peaks in 2008Q3 and 2009Q1. Excluding mortgage and HELOC balances, consumer indebtedness fell 1.5% in the quarter and, after having fallen for six consecutive quarters, stands at $2.31 trillion, 8.4% below its 2008Q4 peak.

For the first time since early 2006, total household delinquency rates declined in 2010Q2. As of June 30, 11.4% of outstanding debt was in some stage of delinquency, compared to 11.9% on March 31. and 11.2% a year ago. Currently about $1.3 trillion of consumer debt is delinquent and $986 billion is seriously delinquent (at least 90 days late or "severely derogatory"). Delinquent balances are now down 2.9% from a year ago, but serious delinquencies are up 3.1%.
Housing Starts and the Unemployment Rate
by Calculated Risk on 8/17/2010 07:08:00 PM
An update on a theme ...  Click on graph for larger image in new window.
This graph shows single family housing starts and the unemployment rate through July (inverted).
You can see both the correlation and the lag. The lag is usually about 12 to 18 months, with peak correlation at a lag of 16 months for single unit starts. The 2001 recession was a business investment led recession, and the pattern didn't hold.
Usually housing starts and residential construction employment lead the economy out of a recession, but not this time because of the huge overhang of existing housing units. After rebounding a little - mostly because of the home buyers tax credit - housing starts (blue) have moved mostly sideways (and down some recently).
This is what I expected when I first posted the above graph a year ago. I wrote:
[T]here is still far too much existing home inventory, a sharp bounce back in housing starts is unlikely, so I think ... a rapid decline in unemployment is also unlikely.Usually near the end of a recession, residential investment (RI) picks up as the Fed lowers interest rates. This leads to job creation and also household formation - and that leads to even more demand for housing units - and more jobs, and more households - a virtuous cycle that usually helps the economy recovery.
Note: RI is mostly new home sales and home improvement.
However this time, with the huge overhang of existing housing units, this key sector isn't participating. So in this recovery there is less job creation, less household formation, and less demand for housing units than a normal recovery. This is sort of a circular trap for both GDP growth and employment.
This is one of the reasons I expect the unemployment rate to tick up over the next several months.
Regional Reports: Home Sales fell sharply in July
by Calculated Risk on 8/17/2010 03:30:00 PM
From DataQuick:
A total of 18,946 new and resale homes were sold in Los Angeles, Riverside, San Diego, Ventura, San Bernardino and Orange counties in July. That was down 20.6 percent from 23,871 in June, and down 21.4 percent from 24,104 for July 2009, according to MDA DataQuick of San Diego.Other reports show similar declines as home sales fell sharply all across the country in July. We are now seeing double-digit months of supply nationwide - and we might even see the months of supply metric reach 1 year. The previous months-of-supply high for this downturn was 11.2 months in 2008.
This was the slowest July since 2007, when 17,867 homes were sold, and the second-slowest since July 1995, when 16,225 sold.
Housing economist Thomas Lawler's preliminary estimate for existing home sales in July is 3.95 million SAAR. If so, this would be fewest sales since 1996. Lawler's estimate for inventory in July was 4.04 million (although it is a bit of a mystery how the NAR calculates inventory). That would mean 12.3 months of supply!
A normal housing market usually has under 6 months of supply. The following graph shows the relationship between supply and house prices (using Case-Shiller).
 Click on graph for larger image in new window.
This graph show months of supply and the annualized change in the Case-Shiller Composite 20 house price index.
Below 6 months of supply (blue line) house prices are typically rising (black line).
Above 6 or 7 months of supply, house prices are usually falling. This isn't perfect - it is just a guideline. Over the last year, there have been many programs aimed at supporting house prices, and house prices increased slightly even with higher than normal supply. However those programs have mostly ended.
The dashed red line is the estimate for months of supply in July. Through the roof! And I expect we will see double-digit months-of-supply for a number of months.
This is a key reason why I expect house prices to fall further later this year as measured by the Case-Shiller and CoreLogic repeat sales house price indexes, although I don't expect huge declines like in 2008.


