 RSS Feed
 by Calculated Risk on 7/22/2010 01:35:00 PM
Thursday, July 22, 2010
Hotel Occupancy Rate above 70% last week
Hotel occupancy is one of several industry specific indicators I follow ...
From HotelNewsNow.com: STR: US hotel results for week ending 17 July
In year-over-year measurements, the industry’s occupancy increased 7.3 percent to 71.0 percent. Average daily rate rose 1.6 percent to US$99.07 Revenue per available room went up 9.0 percent to US$70.30.The following graph shows the four week moving average for the occupancy rate by week for 2008, 2009 and 2010 (and a median for 2000 through 2007).
 Click on graph for larger image in new window.
Notes: the scale doesn't start at zero to better show the change. The graph shows the 4-week average, not the weekly occupancy rate.
On a 4-week basis, occupancy is up 6.8% compared to last year (the worst year since the Great Depression) and 4.7% below the median for 2000 through 2007.
On a weekly basis this is the first week since summer 2008 with the occupancy rate above 70%. In 2009, the occupancy rate peaked at 67% in mid-July.
Data Source: Smith Travel Research, Courtesy of HotelNewsNow.com
Existing Home Inventory increases 4.7% Year-over-Year
by Calculated Risk on 7/22/2010 11:19:00 AM
Earlier the NAR released the existing home sales data for June; here are a couple more graphs ...
The first graph shows the year-over-year (YoY) change in reported existing home inventory and months-of-supply. Inventory is not seasonally adjusted, so it really helps to look at the YoY change.  Click on graph for larger image in new window.
Inventory increased 4.7% YoY in June. This is the third consecutive month of a year-over-year increases in inventory, and this is the largest YoY increase since early 2008.
This increase in inventory is especially bad news because the reported inventory is already historically very high, and the 8.9 months of supply in June is well above normal.
The months-of-supply will jump in July as sales collapse - probably to double digits - and a double digit months-of-supply would be a really bad sign for house prices ... The second graph shows NSA monthly existing home sales for 2005 through 2010 (see Red columns for 2010).
Sales (NSA) in June 2010 were 8.3% higher than in June 2009, and also higher than in June 2008.
With the expiration of the tax credit, I expect to see existing home sales below last year starting in July. In fact I expect sales in July to be well below last year, and probably the lowest since 1997 (or so).
This was another a weak report. Sales were slightly above expectations (5.37 million at a seasonally adjusted annual rate vs. expectations of 5.3 million), but the YoY increase in inventory and the increase in months-of-supply are the real stories.
If months-of-supply increases sharply as I expect, then there will be additional downward pressure on house prices.
Existing Home Sales decline in June
by Calculated Risk on 7/22/2010 10:00:00 AM
The NAR reports: Existing-Home Sales Slow in June but Remain Above Year-Ago Levels
Existing-home sales, which are completed transactions that include single-family, townhomes, condominiums and co-ops, fell 5.1 percent to a seasonally adjusted annual rate of 5.37 million units in June from 5.66 million in May, but are 9.8 percent higher than the 4.89 million-unit pace in June 2009.
...
Total housing inventory at the end of June rose 2.5 percent to 3.99 million existing homes available for sale, which represents an 8.9-month supply at the current sales pace, up from an 8.3-month supply in May.
 Click on graph for larger image in new window.
This graph shows existing home sales, on a Seasonally Adjusted Annual Rate (SAAR) basis since 1993.
Sales in June 2010 (5.37 million SAAR) were 5.1% lower than last month, and were 9.8% higher than June 2009 (4.89 million SAAR).
 The second graph shows nationwide inventory for existing homes.
According to the NAR, inventory increased to 3.99 million in June from 3.89 million in May. The all time record high was 4.58 million homes for sale in July 2008.
Inventory is not seasonally adjusted and there is a clear seasonal pattern with inventory increasing in the spring and into the summer. I'll have more on inventory later ...
 The last graph shows the 'months of supply' metric.
Months of supply increased to 8.9 months in June from 8.3 months in May. A normal market has under 6 months of supply, so this is already high - and probably excludes some substantial shadow inventory. And the months of supply will increase sharply next month when sales collapse.
I'll have more ...
Weekly Initial Unemployment Claims increase to 464,000
by Calculated Risk on 7/22/2010 08:30:00 AM
The DOL reports on weekly unemployment insurance claims:
In the week ending July 17, the advance figure for seasonally adjusted initial claims was 464,000, an increase of 37,000 from the previous week's revised figure of 427,000. The 4-week moving average was 456,000, an increase of 1,250 from the previous week's revised average of 454,750.
...
The advance number for seasonally adjusted insured unemployment during the week ending July 10 was 4,487,000, a decrease of 223,000 from the preceding week's revised level of 4,710,000.
 Click on graph for larger image in new window.
This graph shows the 4-week moving average of weekly claims since January 2000.
The four-week average of weekly unemployment claims increased this week by 1,250 to 456,000.
The dashed line on the graph is the current 4-week average.
The 4-week average of initial weekly claims has been at about the same level since December 2009 (eight months) and the 4-week average of 456,000 is high historically, and suggests a weak labor market.
Wednesday, July 21, 2010
Office Vacancy, Lease Rates and New Investment
by Calculated Risk on 7/21/2010 10:29:00 PM
Voit Real Estate released their Q2 quarterly reports today for CRE in Las Vegas, Phoenix, San Diego, Orange County and several other southwest cities.
These two graphs from the O.C. office report really tell a story ... Click on graph for larger image in new window.
The first graph shows the vacancy rate and amount of new construction. Notice that new construction has fallen to almost zero this year, and the vacancy rate in Q2 was 18.34%, slightly above the Q1 rate of 18.21%.
Look back at the early '90s when the vacancy rate was at about the same level (in '93 and '94), there was very little building for the next three years even with the vacancy rate falling.
These is so much excess capacity that there is no need for new investment for some time. The second graph shows the average full-service monthly lease rate per sq ft.
This is just asking rates, but it looks like rents are off about 25% to 30%, and are back to 1999 levels.
Party like it's 1999!
This is just one area, but something similar is happening in most cities around the country. This also shows up in the Architecture Billings Index that showed contraction again in June. Historically the billings index will turn up 6 to 9 months before an increase in non-residential structure investment - there is a long way to go!
Excess Capacity and Housing
by Calculated Risk on 7/21/2010 07:39:00 PM
Fed Chairman Ben Bernanke was asked today why he thought companies with significant cash weren't investing. His answer was that most companies currently have excess capacity.
Bernanke was also asked about small companies having trouble getting financing, and he pointed out that small companies reported their number one problem is "lack of customers", not difficulties in obtaining financing.
This excess capacity or lack of demand - and therefore lack of new investment - is a key reason why the recovery is sluggish.
One of the few sectors seeing new investment is the semiconductor equipment manufacturers - Intel, Taiwan Semiconductor and others are making new investments in equipment to meet increased demand - and Applied Material, LAM Research, KLA-Tencor, Cymer and others are all seeing a boom in business. I've spoken with companies in the semiconductor equipment sector, and they are hiring like crazy (probably all of these companies are). But this is a small part of the economy ...
Most other sectors, from autos to commercial real estate, and especially residential real estate have too much capacity. Away from equipment and software, investment is still very weak.
As we've discussed many times, usually residential investment is the key investment sector for the economy in the early stages of a recovery. But not this time because of the oversupply of existing housing units.
There is some good news:
However the bad news is:
Eventually this excess supply will be absorbed, and new residential investment will increase - but that will not happen until the excess inventory is reduced significantly.
1Analysis: Housing Units added to stock in 2010
Yesterday the Census Bureau reported housing starts fell in June to a 549 thousand seasonally adjusted annual rate. As I noted yesterday, this is good news for the housing market longer term (because of the excess housing units), but bad news for the economy and employment short term.
The table below is based on the data through June, and shows an estimate of the number of housing units that will be added to the stock in 2010 (based on completions from the Census Bureau).
Housing units include single family homes (included as 1 to 4 units), apartments (5+ units), and mobile homes. Demolitions are subtracted from the stock (note: demolitions are the hardest to estimate).
| (in thousands) | 2009 | First Half 2010 | 2010 Estimate |
|---|---|---|---|
| 1 to 4 units | 534.6 | 243.8 | 500 |
| 5+ units | 259.8 | 86.8 | 150 |
| Mobile Homes1 | 53 | 26 | 55 |
| Sub-Total | 848.4 | 356.6 | 705 |
| Demolitions2 | 200 | 100 | 200 |
| Added to Stock | 648.4 | 256.6 | 505 |
1 Actual through May 2010, June estimated.
2 estimated.
Notice that the number of "5+ units" completed in 2010 is about to collapse. This is already in the works as shown in the following diagram:
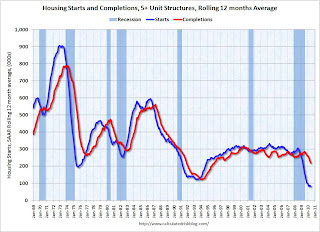 Click on graph for larger image in new window.
The blue line is for multifamily starts and the red line is for multifamily completions. All the multifamily units that will be delivered in 2010 have already been started since, according to the Census Bureau, it takes on average over 1 year to complete these projects.
Since multifamily starts collapsed in 2009, completions will collapse in 2010.
In June 2010, builders started 8,200 apartment units (NSA), and completed 18,200 units. This level of starts has been steady all year, and completions should drop sharply in the next few months. As an aside, this suggests that construction employment will decline further over the next few months.
Similar logic applies to single family units, although these only take around 7 months to complete. Most of the housing units that will be completed this year have already been started. Builders completed 243,800 units (1 to 4 units) in the first half of 2010. Based on starts, builders will probably complete about the same number of units in the 2nd half of the year.
The manufactured homes data is from the Census Bureau through May (and demolitions are estimated).
AIA: Architecture Billings Index shows contraction in June
by Calculated Risk on 7/21/2010 03:59:00 PM
Note: This index is a leading indicator for new Commercial Real Estate (CRE) investment.
Birmingham Business Journal reports that the American Institute of Architects’ Architecture Billings Index increased to 46 in June from 45.8 in May. Any reading below 50 indicates contraction.
The ABI press release is not online yet. Click on graph for larger image in new window.
This graph shows the Architecture Billings Index since 1996. The index has remained below 50, indicating falling demand, since January 2008.
Note: Nonresidential construction includes commercial and industrial facilities like hotels and office buildings, as well as schools, hospitals and other institutions.
This suggests the slump for commercial real estate design is ongoing. According to the AIA, there is an "approximate nine to twelve month lag time between architecture billings and construction spending" on non-residential construction. So there will probably be further declines in CRE investment into 2011.
Live Feeds: Bernanke Testimony at 2 PM ET
by Calculated Risk on 7/21/2010 01:50:00 PM
Here are two live feeds for Fed Chairman Ben Bernanke's testimony to the Senate Banking Committee: The Semiannual Monetary Policy Report to the Congress
Here is the CNBC feed.
Here is the C-Span3 Link
Prepared testimony: Semiannual Monetary Policy Report to the Congress
Existing Homes: Months of Supply and House Prices
by Calculated Risk on 7/21/2010 12:08:00 PM
Earlier I mentioned that a normal housing market usually has under 6 months of supply. The NAR reported that months of supply was at 8.3 months in May, and the months of supply was probably be higher in June (to be reported tomorrow).
A quick estimate: If sales are 5.3 million (SAAR) in June, and inventory stays the same at 3.9 million units, the months of supply will rise to 8.8 months in June.
This is calculated as: 3.9 divided by 5.3 * 12 (months) = 8.8 months of supply.
For July, if sales fall to 4.5 million (it could be lower) and inventory is still at 3.9 million units, months of supply will rise to 10.4 months.
I think these estimates are conservative (actual will probably be higher). For reference, the all time record high was 11.2 months of supply in 2008.
This level of supply will put additional downward pressure on house prices. Click on graph for larger image in new window.
This graph show months of supply and the annualized change in the Case-Shiller Composite 20 house price index.
Below 6 months of supply (blue line) house prices are typically rising (black line).
Above 6 or 7 months of supply house prices are usually falling (although there were many programs to support house prices over the last year).
The dashed red line is the estimate for months of supply in June and July.
This is a key reason why I expect house prices to fall further later this year as measured by the Case-Shiller and CoreLogic repeat sales house price indexes.
WSJ: Housing Market Stumbles
by Calculated Risk on 7/21/2010 08:55:00 AM
Nick Timiraos and Robbie Whelan write at the WSJ Housing Market Stumbles. A few excerpts:
The Wall Street Journal's quarterly survey of housing-market conditions in 28 major metropolitan areas shows that inventory levels have grown in many markets.A few comments:
... newly signed contracts in May and June have plunged. ...
More broadly, the housing market faces two big problems: too many homes and falling demand.


