by Calculated Risk on 2/26/2010 11:11:00 PM
Friday, February 26, 2010
Unofficial Problem Bank List increases Significantly
This is an unofficial list of Problem Banks compiled only from public sources. Changes and comments from surferdude808:
The Unofficial Problem Bank List underwent major changes during the week as aggregate assets for all institutions were updated to 2009q4 from 2009q3 and the FDIC finally released its enforcement actions issued during January 2010.
The list now includes 644 institutions, up from 617 last week, as 33 institutions with assets of $12 billion were added while 6 with assets of $1.3 billion were deleted. Despite the additions, aggregate assets fell from $329 billion to $326 billion. For the 616 institutions that stayed on the list from last week, their aggregate assets dropped $13.8 billion during the fourth quarter.
Bank Failure #22: Rainier Pacific Bank, Tacoma, Washington
by Calculated Risk on 2/26/2010 09:12:00 PM
Day of reckoning has come
As sun sets westward
by Soylent Green is People
From the FDIC: Umpqua Bank, Roseburg, Oregon, Assumes All of the Deposits of Rainier Pacific Bank, Tacoma, Washington
Rainier Pacific Bank, Tacoma, Washington, was closed today by the Washington Department of Financial Institutions, which appointed the Federal Deposit Insurance Corporation (FDIC) as receiver....
As of December 31, 2009, Rainier Pacific Bank had approximately $717.8 million in total assets and $446.2 million in total deposits. ...
Bank Failure #21: Carson River Community Bank, Carson City, Nevada
by Calculated Risk on 2/26/2010 08:06:00 PM
Bright lights! Fast Times! No Limits!
Woe, The taps gone dry.
by Soylent Green is People
From FDIC: Heritage Bank of Nevada, Reno, Nevada, Assumes All of the Deposits of Carson River Community Bank, Carson City, Nevada
Carson River Community Bank, Carson City, Nevada, was closed today by the Nevada Department of Business and Industry, Financial Institutions Division, which appointed the Federal Deposit Insurance Corporation (FDIC) as receiver. ...A small one ...
As of December 31, 2009, Carson River Community Bank had approximately $51.1 million in total assets and $50.0 million in total deposits....
The FDIC estimates that the cost to the Deposit Insurance Fund (DIF) will be $7.9 million. ... Carson River Community Bank is the 21st FDIC-insured institution to fail in the nation this year, and the first in Nevada. The last FDIC-insured institution closed in the state was Community Bank of Nevada, August 14, 2009.
Fannie Mae Reports $15.2 Billion Loss
by Calculated Risk on 2/26/2010 07:36:00 PM
Press Release: Fannie Mae Reports Fourth-Quarter and Full-Year 2009 Results
Fannie Mae reported a net loss of $15.2 billion in the fourth quarter of 2009 ... For the full year of 2009, Fannie Mae reported a net loss of $72.0 billion...I'm old enough to remember when $15 billion was a large number.
The fourth-quarter loss resulted in a net worth deficit of $15.3 billion as of December 31, 2009, taking into account unrealized gains on available-for-sale securities during the fourth quarter. As a result, on February 25, 2010, the Acting Director of the Federal Housing Finance Agency submitted a request for $15.3 billion from Treasury on the company’s behalf. FHFA has requested that Treasury provide the funds on or prior to March 31, 2010.
...
Although there have been signs of stabilization in the housing market and economy, we expect that our credit-related expenses will remain high in the near term due in large part to the stress of high unemployment and underemployment on borrowers and the fact that many borrowers who owe more on their mortgagees than their houses are worth are defaulting.
...
We expect to have a net worth deficit in future periods, and therefore will be required to obtain additional funding from Treasury ...
Restaurant Index declines in January
by Calculated Risk on 2/26/2010 05:12:00 PM
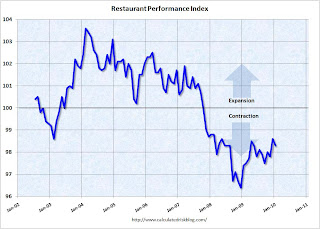
Note: This index is based on year-over-year performance, and the headline index might be slow to recognize a pickup in business.  Click on graph for larger image in new window.
Unfortunately the data for this index only goes back to 2002.
Note: Any reading below 100 shows contraction for this index.
From the National Restaurant Association (NRA): Restaurant Performance Index Declines Slightly in January, But Optimism for Future Business Conditions Strengthens
[T]he Association’s Restaurant Performance Index (RPI) ... stood at 98.3 in January, down 0.3 percent from December’s level.
“Although the current situation indicators remained soft in January, the Expectations Index rose above 100 for the first time in 9 months,” said Hudson Riehle, senior vice president of Research and Knowledge Group for the National Restaurant Association. “Restaurant operators are relatively optimistic about improving sales growth and economic conditions in the months ahead, and their capital spending plans rose to the highest level in five months.”
January’s mark of 98.3 represents the 27th consecutive month of an index below 100, which signifies contraction in the index of key industry indicators. The full report is available online.
...
The Current Situation Index, which measures current trends in four industry indicators (same-store sales, traffic, labor and capital expenditures), stood at 96.6 in January – down 0.8 percent from December. In addition, January represented the 29th consecutive month below 100, which signifies contraction in the current situation indicators.
...
Restaurant operators also reported softer customer traffic results in January. Twenty-six percent of restaurant operators reported an increase in customer traffic between January 2009 and January 2010, down from 30 percent who reported higher customer traffic in December. Fifty-four percent of operators reported a traffic decline in January, up from 47 percent who reported lower traffic in December.
emphasis added
Freddie Mac: Delinquencies Increase Sharply in January
by Calculated Risk on 2/26/2010 02:24:00 PM
Here is the monthly Freddie Mac hockey stick graph ... Click on graph for larger image in new window.
Freddie Mac reported that the rate of serious delinquencies - at least 90 days behind - for conventional loans in its single-family guarantee business increased to 4.03% in January 2010, up from 3.87% in December - and up from 1.98% in January 2009.
"Single-family delinquencies are based on the number of mortgages 90 days or more delinquent or in foreclosure as of period end ..."
Just more evidence of the growing delinquency problem, although some of these loans may be in the trial modification programs and are still included as delinquent until they are converted to a "permanent mod". If the trial is cancelled, the loan stays delinquent (until foreclosure).
The data from Fannie Mae will be released later ...
Tax Credits: Vehicle and Existing Home Sales
by Calculated Risk on 2/26/2010 01:29:00 PM
By request, here is a graph overlaying light vehicle sales and existing home sales - and showing the impact of "cash for clunkers" and the "first time home buyer" tax credit. (ht Brian) Click on graph for larger image in new window.
The red line (left axis) is vehicle sales. The blue line (right axis) is existing home sales since Jan 2008. Both are in millions of units at a Seasonally Adjusted Annual Rate (SAAR).
The Cash for Clunkers program was effective on July 1, 2009, but didn't really start until near the end of July. The program was expanded in early August, and ended on August 24th.
The First Time Home Buyer tax credit was passed in February with an initial deadline to close on the home by November 30, 2009. The home buyer tax credit was extended and expanded at the end of October, and now buyers must sign a contract by April 30, 2010, and close by June 30, 2010.
There will probably be another surge in existing home sales in May and June (reported when sales close). And then sales will probably decline again.
More on Existing Home Sales
by Calculated Risk on 2/26/2010 11:07:00 AM
Earlier the NAR released the existing home sales data for January; here are a few more graphs ...  Click on graph for larger image in new window.
This graph shows NSA monthly existing home sales for 2005 through 2010 (see Red column for Jan 2010).
Sales (NSA) in January 2010 were 7% higher than in January 2009, and slightly lower than in January 2008.
The second graph shows existing home sales (left axis) and new home sales (right axis) through January. I jokingly refer to this as the "distressing gap". The initial gap was caused by the flood of distressed sales. This kept existing home sales elevated, and depressed new home sales since builders couldn't compete with the low prices of all the foreclosed properties.
The recent spike in existing home sales was due primarily to the first time homebuyer tax credit.
The following graph shows the same information as a ratio - existing home sales divided by new home sales - through January 2010. This ratio is just off from the all time high in November when existing home sales were artificially boosted by the first time home buyer tax credit.
Eventually this ratio will return to the historical range of around 6 existing home sales per new home sale. Right now this graph shows that the housing market is far from normal.
Existing Home Sales Decline Sharply in January
by Calculated Risk on 2/26/2010 10:00:00 AM
The NAR reports: Existing-Home Sales Down in January
Existing-home sales – including single-family, townhomes, condominiums and co-ops – dropped 7.2 percent to a seasonally adjusted annual rate1 of 5.05 million units in January from a revised 5.44 million in December, but remain 11.5 percent above the 4.53 million-unit level in January 2009.
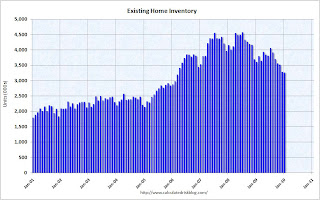
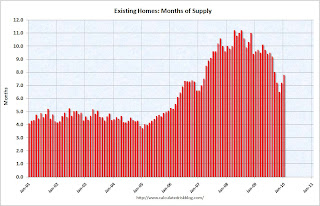
Total housing inventory at the end of January fell 0.5 percent to 3.27 million existing homes available for sale, which represents a 7.8-month supply at the current sales pace, up from a 7.2-month supply in December.
 Click on graph for larger image in new window.
This graph shows existing home sales, on a Seasonally Adjusted Annual Rate (SAAR) basis since 1993.
Sales in Jan 2010 (5.05 million SAAR) were 7.2% lower than last month, and were 11.5% higher than Jan 2009 (4.53 million SAAR).
This is a sharp drop from November when many of the transactions were due to first-time homebuyers rushing to beat the initial expiration of the tax credit (that has been extended). That pushed sales far above the historical normal level; based on normal turnover, existing home sales would be in the 4.5 to 5.0 million SAAR range.
 The second graph shows nationwide inventory for existing homes. According to the NAR, inventory decreased to 3.27 million in January from 3.29 million in December. The all time record high was 4.57 million homes for sale in July 2008.
 This is not seasonally adjusted and this decline is mostly seasonal - inventory should increase in the Spring.
 The third graph shows the 'months of supply' metric.
Months of supply increased to 7.8 months in January.
A normal market has under 6 months of supply, so this is high - and probably excludes some substantial shadow inventory.
I'll have more later ...
Q4 GDP Revised to 5.9%
by Calculated Risk on 2/26/2010 08:30:00 AM
The headline GDP number was revised up to 5.9% annualized growth in Q4 (from 5.7%), however most of the improvement in the revision came from changes in private inventories. Excluding inventory changes, GDP would have been revised down to around 1.9% from 2.2%.
This table shows the changes from the "advance estimate" to the "second estimate" for several key categories:
| Advance | Second Estimate | |
|---|---|---|
| GDP | 5.7% | 5.9% |
| PCE | 2.0% | 1.7% |
| Residential Investment | 5.7% | 5.0% |
| Structures | -15.4% | -13.9% |
| Equipment & Software | 13.3% | 18.2% |
Changes in private inventories are transitory (only lasts a few quarters at the start of a recovery), and although the headline number was revised up, final demand was weaker than in the advance estimate.


