by Calculated Risk on 3/04/2009 10:00:00 AM
Wednesday, March 04, 2009
February ISM Non-Manufacturing Index Shows Faster Contraction
From the Institute for Supply Management: February 2009 Non-Manufacturing ISM Report On Business®
"The NMI (Non-Manufacturing Index) registered 41.6 percent in February, 1.3 percentage points lower than the 42.9 percent registered in January, indicating contraction in the non-manufacturing sector for the fifth consecutive month at a slightly faster rate. The Non-Manufacturing Business Activity Index decreased 4 percentage points to 40.2 percent. The New Orders Index decreased 0.9 percentage point to 40.7 percent, and the Employment Index increased 2.9 percentage points to 37.3 percent. The Prices Index increased 5.6 percentage points to 48.1 percent in February, indicating a slower decrease in prices from January. According to the NMI, one non-manufacturing industry reported growth in February. Respondents are concerned about the soft market conditions, the negative outlook for employment and the overall state of the economy."This is another weak report.
Treasury Releases Detailed Guidelines on Mortgage Modification Plan
by Calculated Risk on 3/04/2009 09:24:00 AM
From MarketWatch: Treasury says mortgage plan to help up to 9 mln homeowners
The Treasury Department released guidelines to its mortgage modification plan on Wednesday and said that the program will help up to 9 million homeowners avoid foreclosure. The guidelines will enable servicers to begin modifying mortgages right away ... The Treasury program also includes incentives for removing second liens on loans.From financialstability.gov (Treasury site):
Summary of Guidelines
Modification Program Guidelines
Counselor Q&A
Fact Sheet
Report: 8.3 Million U.S. Homeowners with Negative Equity
by Calculated Risk on 3/04/2009 09:08:00 AM
From Bloomberg: More Than 8.3 Million U.S. Mortgages Are Underwater
More than 8.3 million U.S. mortgage holders owed more on their loans in the fourth quarter than their property was worth as the recession cut home values by $2.4 trillion last year, First American CoreLogic said.Late last year Mark Zandi at Moody's Economy.com estimated that there were "roughly 12 million households, or 16%, owe more than their homes are worth". The difference between the estimates is probably because a large number of homeowners have little equity - and small changes in home price assumptions change the number underwater significantly. The differences in percentages is because CoreLogic is using only households with mortgages; Zandi used all households (about 31% of households have no mortgages).
An additional 2.2 million borrowers will be underwater if home prices decline another 5 percent, First American, a Santa Ana, California-based seller of mortgage and economic data, said in a report today. Households with negative equity or near it account for a quarter of all mortgage holders.
Toll Brothers: More Losses, No Pick-up in Activity
by Calculated Risk on 3/04/2009 06:48:00 AM
"We have not yet seen a pick-up in activity at our communities other than ordinary seasonal increases for this time of year."Press Release: Toll Brothers Reports 1st Qtr 2009 Results
Robert I. Toll, chairman and chief executive officer, March 4, 2009
Toll Brothers ... today reported a FY 2009 first quarter net loss of $88.9 million ... which included pre-tax write-downs totaling $156.6 million.Toll's normal cancellation rate is about 7%.
...
Joel H. Rassman, chief financial officer, stated: "Given the numerous uncertainties related to sales paces, sales prices, mortgage markets, cancellations, market direction and the potential for and size of future impairments, it is particularly difficult in the current climate to provide guidance for the rest of FY 2009. As a result, we will not provide earnings guidance at this time."
...
FY 2009's first-quarter cancellation rate (current-quarter cancellations divided by current-quarter signed contracts) was 37.1% ...
In summary: More losses. More write-downs. More cancellations. No guidance. No pick-up in activity.
Tuesday, March 03, 2009
Interesting Technical Pattern Developing*
by Calculated Risk on 3/03/2009 09:30:00 PM
 Click on graph for larger image in new window.
Reader Nate suggests the S&P 500 is just tracing out the Mortgage Pig™. (ht Nate and IF)
* IF suggested the post title.
Mortgage Pig™ says: "In UR Poolz Killin your convexity."
For those interested, here are few sources for futures and the foreign markets.
Bloomberg Futures.
CBOT mini-sized Dow
CME Globex Flash Quotes
Futures from barchart.com
And the Asian markets.
And a graph of the Asian markets.
Best to all.
Office Furniture: Cliff Diving
by Calculated Risk on 3/03/2009 08:32:00 PM
From Reuters: U.S. office furniture orders, shipments plunge in January
U.S. office furniture orders and shipments fell about 25 percent in January, reflecting the biggest year-over-year percentage declines since the 2001-02 recession, a trade group said.
The Business and Institutional Furniture Manufacturers Association said January orders fell 25 percent to $565 million and shipments fell 26 percent to $630 million.
BIFMA also lowered its 2009 forecast for orders to a decline of 26.5 percent, compared with its prior estimate of a drop of 11.6 percent.
 Click on graph for larger image in new window.
This graph shows the actual consumption of office furniture in the U.S. (including imports) and the Business and Institutional Furniture Manufacturers Association forecast for 2009.
The slump in the office market - with rapidly rising office vacancies - is having a secondary impact on office suppliers. This is similar to what happened to the home furnishing bust over the last few years because of the bursting of the housing bubble. Based on this forecast, the U.S. office furniture market will probably be back to the 1994 to 1995 level.
Pensions: Another Trillion Dollar Bailout?
by Calculated Risk on 3/03/2009 05:25:00 PM
From David Evans at Bloomberg: Hidden Pension Fiasco May Foment Another $1 Trillion Bailout (ht James & Bob)
Public pension funds across the U.S. are hiding the size of a crisis that’s been looming for years. Retirement plans play accounting games with numbers, giving the illusion that the funds are healthy.Evans points out that many pension plans have been funded based on optimistic projections of future investment returns. He gives several examples including:
...
The misleading numbers posted by retirement fund administrators help mask this reality: Public pensions in the U.S. had total liabilities of $2.9 trillion as of Dec. 16, according to the Center for Retirement Research at Boston College. Their total assets are about 30 percent less than that, at $2 trillion.
With stock market losses this year, public pensions in the U.S. are now underfunded by more than $1 trillion.
The nation’s largest public pension fund, California Public Employees’ Retirement System, has been reporting an expected rate of return of 7.75 percent for the past eight years, and 8 percent before that, according to Calpers spokesman Clark McKinley.There is much more in the article.
Its annual return during the decade from Dec. 31, 1998, to Dec. 31, 2008, has been 3.32 percent, and last year, when markets tanked, it lost 27 percent.
Note: Back in 2007 Evans wrote a great article on a Florida state run investment pool investing in SIVs.
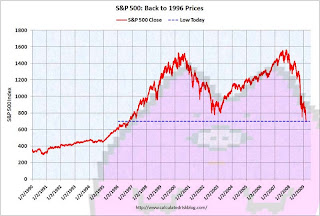
Stock Market: S&P 100 points from 1995
by Calculated Risk on 3/03/2009 03:49:00 PM
The S&P 500 closed below 700 today at 696 and change. We are back to 1996 prices ...
 Click on graph for larger image in new window.
By popular demand I've extend this graph back to 1990.
The low in 1996 was 598.48.
The second graph is from Doug Short of dshort.com (financial planner): "Four Bad Bears". (If not updated right way, Doug should update in a few minutes)
The 2nd worst bear market in the U.S. in 100 years.
Note that the Great Depression crash is based on the DOW; the three others are for the S&P 500.
GM Sales off 53%, Toyota Off 40%
by Calculated Risk on 3/03/2009 01:52:00 PM
Headline from MarketWatch: GM U.S. February sales down 53% to 126,170 units
Also from MarketWatch: Toyota U.S. sales down 39.8% to 109,583 units in February
Last month GM reported U.S. sales fell 48.9% compared to January 2008, so the numbers are still getting worse.
Transportation: Record Idle Ships, Trucking Tonnage Increases Slightly
by Calculated Risk on 3/03/2009 01:05:00 PM
From the Journal of Commerce: Idle Box Fleet Reaches 1.35M TEUs (hat tip Vincent)
Idled ocean container capacity on March 2 reached a record 1.35 million TEUs with 453 ships without work as carriers continue to axe services in the face of collapsing cargo volumes and tumbling freight rates across all trade routes.From the American Trucking Association: ATA Truck Tonnage Index Rose 3 Percent in January
The jobless figure, up from 392 vessels of 1.1 million TEUs two weeks ago, is equivalent to 10.7 percent of the world cellular container ship fleet in capacity terms, according to AXS-Alphaliner, the Paris-based consultant.
This is the highest unemployment rate in the history of container shipping and is three times the 3.5 percent jobless figure in the depth of the 2002 bear market.
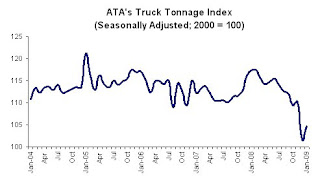
 Click on graph for larger image in new window.
The American Trucking Associations’ advanced seasonally adjusted For-Hire Truck Tonnage Index climbed 3 percent in January 2009, marking only the second month-to-month increase in the last seven months. Still, the gain did little to erase the revised 7.8 percent contraction in December 2008. In January, the seasonally adjusted tonnage index equaled just 104.7 (2000 = 100), its second-lowest level since October 2002. ...
Compared with January 2008, the index declined 10.8 percent, which was slightly better than December’s 12.5 percent year-over-year drop.
ATA Chief Economist Bob Costello said that there was no reason to get excited about January’s 3 percent month-to-month improvement. “Tonnage will not fall every month, and just because it rises every now and then doesn’t mean the economy is on the mend,” Costello said. “Furthermore, tonnage is contracting significantly on a year-over-year basis, which is highlighting the current weakness in the freight environment.”


