 RSS Feed
 by Calculated Risk on 1/11/2007 11:15:00 AM
Thursday, January 11, 2007
Homebuilder: Housing to "remain challenging throughout 2007"
From MarketWatch: M/I Homes quarterly contracts plunge 61%
[M/I Homes] said its cancellation rate rose to 63% in the fourth quarter from 27% in the year-ago period, and from 42% in the third quarter.And 2007 doesn't look any better:
"... housing conditions are likely to remain challenging throughout 2007 and we see no reason to deviate from that belief."
[said Chief Executive Robert Schottenstein]
Wednesday, January 10, 2007
November Trade Deficit: $58.2 billion
by Calculated Risk on 1/10/2007 09:47:00 AM
The trade deficit decreased in November to $58.2 Billion. Looking at the trade balance, excluding petroleum products, the deficit has been fairly stable since the second half of 2005. Click on graph for larger image.
The red line is the trade deficit excluding petroleum products. (Blue is the total deficit, and black is the petroleum deficit).
It appears the trade deficit, ex-oil, has stabilized or even started to decline.
MBA: Mortgage Applications Increase
by Calculated Risk on 1/10/2007 09:36:00 AM
The Mortgage Bankers Association (MBA) reports: Mortgage Applications Increase Click on graph for larger image.
This week’s results include an adjustment to account for the New Year’s Day holiday. The Market Composite Index, a measure of mortgage loan application volume, was 671.1, an increase of 16.6 percent on a seasonally adjusted basis from 575.6 one week earlier. On an unadjusted basis, the Index increased 33.2 percent compared with the previous week and was up 12 percent compared with the same week one year earlier.Mortgage rates decreased:
The Refinance Index increased by 17.3 percent to 1923.8 from 1640.4 the previous week and the seasonally adjusted Purchase Index increased by 16.2 percent to 472.8 from 406.9 one week earlier.
The average contract interest rate for 30-year fixed-rate mortgages decreased to 6.13 from 6.22 percent ...
The average contract interest rate for one-year ARMs decreased to 5.79 percent from 5.84 ...
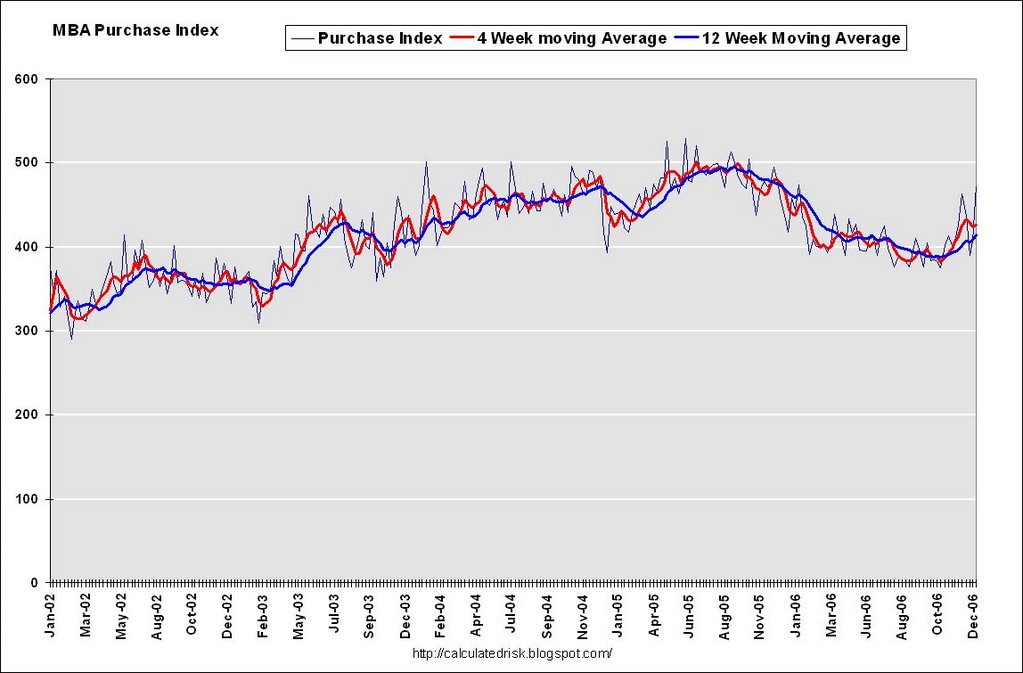 The second graph shows the Purchase Index and the 4 and 12 week moving averages since January 2002. The four week moving average is up 0.5 percent to 426.6 from 424.4 for the Purchase Index.
The refinance share of mortgage activity increased to 48.4 percent of total applications from 48.1 percent the previous week. The adjustable-rate mortgage (ARM) share of activity decreased to 20.1 from 20.4 percent of total applications from the previous week. The ARM share is at its lowest level since July 2003.
Tuesday, January 09, 2007
Increasing Foreclosures
by Calculated Risk on 1/09/2007 02:14:00 PM
From LA Bizjournals: Foreclosures increase 51 percent nationwide
Foreclosures increased 94 percent last year to 157,417 homes in California, as homeowners struggle with fast-rising home payments and a slow-selling market, according to ... ForeclosureS.com.
Nationwide, almost 971,000 foreclosure filings were reported last year, 51 percent more than the 641,000 in 2005, according to the annual report.
Monday, January 08, 2007
Fed's Kohn on Housing
by Calculated Risk on 1/08/2007 03:46:00 PM
From Federal Reserve Vice Chairman Donald L. Kohn: The Economic Outlook. Excerpts on housing:
Uncertainty about where we stand in the housing cycle remains considerable. In part, that is because this housing downturn has differed from some of those in the past in important ways. It was not triggered by a restrictive monetary policy and high interest rates; indeed, relatively low intermediate and long-term interest rates are helping to support the stabilization of this sector. But the current contraction in housing did follow an unusually large run-up in sales and construction and, even more so, in prices relative to the returns on other financial and real assets. Our uncertainty about what pushed home prices and sales to those elevated levels raises questions about how the market will adjust now that expectations of the rate of house price appreciation are being trimmed. And changes in the organization of the construction industry, with activity more concentrated in the hands of large, publicly traded corporations, may also affect the dynamics of prices and activity in response to the inventory overhang.
In my own judgment, housing starts may be not very far from their trough, but the risks around this outlook still are largely to the downside. Although house prices nationally have decelerated noticeably and appear to have fallen in some markets, they are still high relative to rents and interest rates. Building permits decreased substantially again in November, and inventories of unsold homes have only started to edge lower. We also do not know whether the possible stabilization that seems to be taking hold would be immune to a rise in longer-term interest rates should term premiums increase or the federal funds rate fail to follow the downward path currently built into market expectations. Even if starts stabilize at close to current levels, those levels are sufficiently low that overall construction activity would remain a negative for the growth of economic activity in the first half of this year.
Baum: "a False Sense of Complacency"
by Calculated Risk on 1/08/2007 01:27:00 PM
Caroline Baum writes for Bloomberg: Housing Data Yield a False Sense of Complacency. Some excerpts on non-residential construction:
The increase in non-residential construction has helped to offset the decline in housing... Typically commercial activity lags residential -- and the economic cycle. And it makes intuitive sense.
``Once a new subdivision is built and people move in, they look for places to work, shop, eat and have their dry-cleaning done,'' said Ian Shepherdson, chief U.S. economist at High Frequency Economics in Valhalla, New York. ``That's when the new strip malls, schools, churches and office parks start to appear.''
The lag between turning points in residential and non- residential construction is variable, Shepherdson said, but one follows the other as night follows day.
``The plunge in housing construction promises tough times ahead, sooner or later, for the non-residential construction business,'' he said.
More BLS vs. ADP
by Calculated Risk on 1/08/2007 12:20:00 PM
The ADP report has taken quite a beating over the last few days. David Gaffen wrote at the WSJ blog on Friday: ADP in ICU, part II
... anyone who traded on the ADP numbers ahead of today’s report lost money. “There isn’t any hiding from that,” said ... Joel Prakken chairman of Macroeconomic Advisers, the economic consulting firm that partners with Automatic Data Processing to produce the private sector monthly jobs report.And Professor Duy comments on ADP in another great Fed Watch (Recommended reading!): Like a Broken Record
"I do not pay special attention to the ADP report. I simply don’t trust that it provides any useful information above that offered by a host of Wall Street economists. Moreover, when it misses, it misses big."On a slightly different note, Professor Hamilton discusses why he blends the ADP report with the BLS reports.
As I noted last week, I just ignore the ADP report. But I thought I'd take another look.
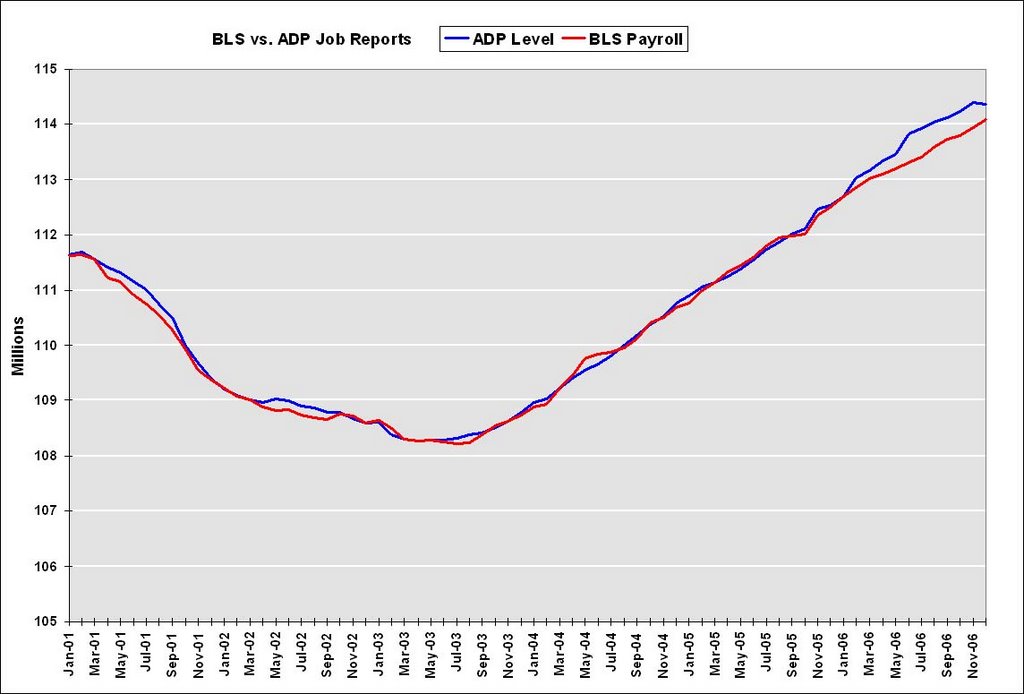
First, it's important to note that the ADP report is for private sector jobs only, and the headline BLS number includes government jobs. So, to compare the ADP report to the BLS payroll report, government jobs should be excluded from the BLS report.
 Click on graph for larger image.
This graph shows total private sector BLS payroll jobs vs. ADP jobs. Special thanks to Paul Kasriel of Northern Trust.
Note that the scale starts at 105 million to show the differences between the reports.
In recent months, the ADP report showed a total of almost 500K more jobs than the BLS report. After the weak December ADP report (showing a monthly decline of 40K jobs) and the strong BLS report (an increase of 150K private sector jobs, 167K including government jobs), the ADP report is showing about 300K more jobs than the BLS report.
This difference led me (and others) to discount the ADP report.
But maybe the ADP report has some merit. In October the BLS announced the preliminary estimate for the 2006 revision to the establishment survey - and the revision appears to be a "larger-than-normal" increase in jobs - perhaps an upwards revision of 800K jobs. So it is very possible, once the actual BLS revision is announced in February that the ADP report was actually pretty close earlier this year.
For now it's probably best to continue to ignore the ADP report (or use Hamilton's 10% suggestion), but I'll take another look at the January numbers.
Friday, January 05, 2007
Professor Case and Sticky House Prices
by Calculated Risk on 1/05/2007 04:35:00 PM
This research from Professor Case shows just how sticky prices are right now.
From the Boston Herald: Buyers vs. homesellers: Standoff could lead to recession
... Wellesley College housing guru Karl Case will release the results of a five-month groundbreaking survey of the housing market in Boston’s suburbs.I suspect a 6.3% price decline in Boston felt like a "price implosion" to some sellers!
And it’s not happy reading.
After tracking 628 homes on the market from July through November, Case found that fewer than a third actually sold.
It paints a picture of a market nearing a standstill, in which would-be sellers are opting to take their homes off the market rather than accept big markdowns.
Over such a lengthy period, even in a slow market, one could expect 70 percent of these homes to have sold, Case estimates.
But Case’s study found only 30 percent moved.
...
Despite the big drop in sales activity, there was no price implosion.
Instead, average selling prices fell just 6.3 percent.
After seeing the value of their homes soar during days of the real estate bubble, home owners are reluctant to give ground on price. Or, as Case puts it, it’s a case of “sticky” prices common to past market downturns.
...the drop in home sales activity could be a more serious economic threat, Case believes.
This research shows the impact of sticky house prices. In a classic housing bust, real estate prices display strong persistence and are sticky downward. Therefore housing price "bubbles" typically do not implode, rather prices deflate slowly in real terms, over several years. As Dr. Case notes, this typically leads to a drop in transactions and can negatively impact the economy.
Let's consider Case's research, and the projections of NAR's Lereah and Fannie Mae's Berson:
NAR Economist David Lereah recently said:
“We’ve entered a more sustainable period of home sales now, and we expect greater support for prices over time as inventory levels are eventually drawn down.”and
“Although some monthly declines are possible, when we look at the forecast for existing-home sales in 2007 on a quarterly basis, we see gradual improvement over the course of the year.”However I believe it is much more likely that sales of existing homes will decline again in 2007. Fannie Mae economist David Berson is forecasting existing home sales to decline to 5.925 million units in '07 (from 6.425 million in '06), and new home sales to 0.975 million units (from 1.05 million).
Partially because of the impact of sticky prices, I think Berson's 2007 estimate will be closer than Lereah's projection. In fact, I think Berson might be a little too optimistic.
Jobs: BLS vs. ADP
by Calculated Risk on 1/05/2007 01:12:00 PM
With regards to the differences between the BLS and ADP job reports, Professor Hamilton notes the
"reaction of many people to such disparate indicators is simply to disregard several of the measures."That describes me; I've just ignored the ADP report.
Dr. Hamilton suggests blending the three measures of employment (BLS Payroll, BLS Survey, ADP):
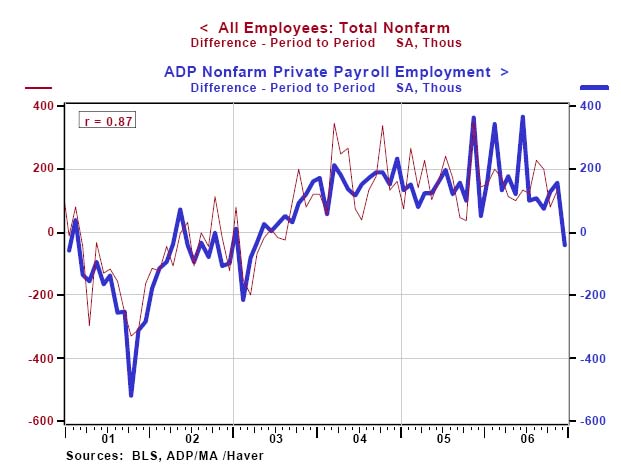
"I've been using a weighted average based on the assumption that the NFP is considerably more reliable than either of the other two, giving NFP a weight of 80% and each of the others 10%."That made me wonder if there is a lag, or some other consistent relationship, between the ADP and BLS reports of employment. I found this graph from Northern Trust's Asha Bangalore:
 Click on graph for larger image.
Note that this graph does not include today' BLS numbers. There appears to be reasonably strong correlation over time, but the monthly differences between the reports can be significant.
It appears that the two series don't diverge for long, so I'd expect better correlation next month (something to remember). This also suggests Dr. Hamilton's blending approach might be helpful - although I'd like to see a graph with the survey data added.
December Employment Report
by Calculated Risk on 1/05/2007 02:50:00 AM
The BLS reports: U.S. nonfarm payrolls rose by 167,000 in December, after a revised 154,000 gain in November. The unemployment rate was steady at 4.5% in December. Click on graph for larger image.
Here is the cumulative nonfarm job growth for Bush's 2nd term. The gray area represents the expected job growth (from 6 million to 10 million jobs over the four year term). Job growth is about in the middle of the expected range.
The following two graphs are the areas I've been watching closely: residential construction and retail employment.
Residential construction employment decreased by 16,200 jobs in December and is down 133.6 thousand, or about 4.0%, from the peak in February. This is the beginning of the loss of several hundred thousand residential construction jobs over the next year or so.
Note the scale doesn't start from zero: this is to better show the change in employment.
Retail employment lost 9,200 jobs in December. The YoY change in retail employment is now -0.4%.
The YoY decrease in retail employment is concerning: see Retail Employment
Overall this is a solid report. The expected job losses in residential construction employment has just started, but the spillover to retail isn't significant yet. I expect the rate of residential construction job losses to increase over the next few months.


