 RSS Feed
 by Calculated Risk on 1/02/2007 06:30:00 PM
Tuesday, January 02, 2007
2007 Economic Predictions
"The models say 'recession'; the mind says 'no way.' I'm going with the mind."
Edward Leamer, UCLA Anderson Forecast, December 7, 2006
 The crystal ball I purchased on Ebay still hasn't arrived, but I suspect it would be cloudy - just like the economic outlook for 2007. Some of the most reliable indictors are waving a red danger flag, as an example:
 Click on graph for larger image.
This graph shows the YoY change in New Home Sales from the Census Bureau. When the YoY change in New Home Sales falls about 20%, usually a recession will follow. The one exception for this data series was the mid '60s when the Vietnam buildup kept the economy out of recession.
Note: the New Home Sales data is smoothed using a three month centered average before calculating the YoY change. The Census Bureau data starts in 1963.
But will the housing bust be enough to take the general economy into recession?
“We're having a lot of problems assessing the impact of the housing market on consumers. We know that it's going to dampen consumer activity. We just don't know how much.”"How much" is the key question. I think the odds of a recession are at least a coin flip at this point, so unlike Professor Leamer, I'm going with the models. With that in mind, here are my predictions for oil prices, the trade deficit, and interest rates. For a long look at housing, see: Housing in 2007.
Peter Morici, economist with the University of Maryland, Dec 31, 2006
Oil Prices: Based on slowing U.S. and world economies, I expect oil prices to fall in 2007. Current the spot prices for WTI are just under $61 per barrel.
Trade Deficit: I expect the U.S. trade deficit to decline in 2007 from the 2006 record of approximately $770 Billion ($643 Billion for through October, 2006). This will be the first decline since 2001.
Economy: Recession. What can I say?
Interest Rates: I expect the Fed to start cutting rates sometime between March and August. I think they will be slow to recognize the downturn, just like in 1990. Still I expect the yield on the Ten Year to be higher by the end of 2007 (currently 4.71%).
Recognizing a recession is hard (almost as hard as predicting a recession correctly). Here are a few quotes from Fed Chairman Alan Greenspan (bear in mind that the recession started in July, 1990):
“In the very near term there’s little evidence that I can see to suggest the economy is tilting over [into recession].” Greenspan, July 1990I won't mind being wrong, and I hope everyone has a great 2007!
“...those who argue that we are already in a recession I think are reasonably certain to be wrong.” Greenspan, August 1990
“... the economy has not yet slipped into recession.” Greenspan, October 1990
Mortgage Lenders Network stops loans
by Calculated Risk on 1/02/2007 06:17:00 PM
The rumors are true. From Reuters: Mortgage Lenders Network stops loans, sets layoffs
Mortgage Lenders Network USA, a large U.S. subprime lender, said it has stopped funding loans and accepting applications for loans, citing deteriorating conditions in the mortgage market, and has temporarily laid off about 80 percent of its 1,800 employees.And they just broke ground on their new campus:
...
Meanwhile, some lenders have been pinched by being forced to buy back loans they sold because of rising delinquencies, and as "warehouse" lenders pull credit lines, analysts said.
Unlike most subprime rivals, Mortgage Lenders increased its lending throughout 2006. It made $3.31 billion of subprime loans in the third quarter, ranking 15th nationwide, according to data from National Mortgage News.
The firm, however, said wholesale market conditions have "deteriorated dramatically" in the last two months.

MLN’s President & CEO Mitch Heffernan surveys the site of MLN’s new corporate headquarters located in Wallingford, CT. Construction is underway on the 305,000 square foot campus.
Lennar: No Sign of Housing Market Recovery
by Calculated Risk on 1/02/2007 10:51:00 AM
From CNNMoney: Lennar warns on earnings.
Lennar, one of the nation's largest home builders, warned that it will miss fourth quarter earnings forecasts and post a net loss as it writes down the value of some of its land and other assets.
Lennar (Charts) also said it has "not yet seen tangible evidence of a market recovery." ... The ongoing weakness in the home building market will cause Lennar to take a pretax impairment charges of $400 million to $500 million due to the revaluation of some of its assets.
Monday, January 01, 2007
More Views on Housing
by Calculated Risk on 1/01/2007 03:55:00 PM
From the Orange County Register Jon Lanser's, Eyeballs on Housing series, on the 2007 housing market:
"Nationally, I expect low levels of sales of both existing and new homes, aggressive pricing of new homes (e.g., a 10 percent decline in price), but very little erosion (2-5 percent) of sales prices of existing homes."
Professor Ed Leamer, Director UCLA Anderson Forecast
"Both sales and prices will be up from 2006. Sales should rise to our 10-year average of 40,100, which puts sales up 10 percent, and prices should rise 7 percent for homes and the 4 percent-5 percent range for condos."
Gary Watts, broker/economist on Orange County housing.
Friday, December 29, 2006
Housing in 2007
by Calculated Risk on 12/29/2006 02:56:00 PM
For the overall U.S. economy in 2007, the overwhelming consensus view is for a soft landing, with real GDP growth between 2.5% and 3.0%. Although there are several frequently mentioned risks to this view - such as inflation, higher energy prices, a currency crisis, exogenous events - the housing market is probably the main downside risk to the economy.
So how will the housing market perform in 2007?
Let's start with what we know:
1) Inventories are at record levels.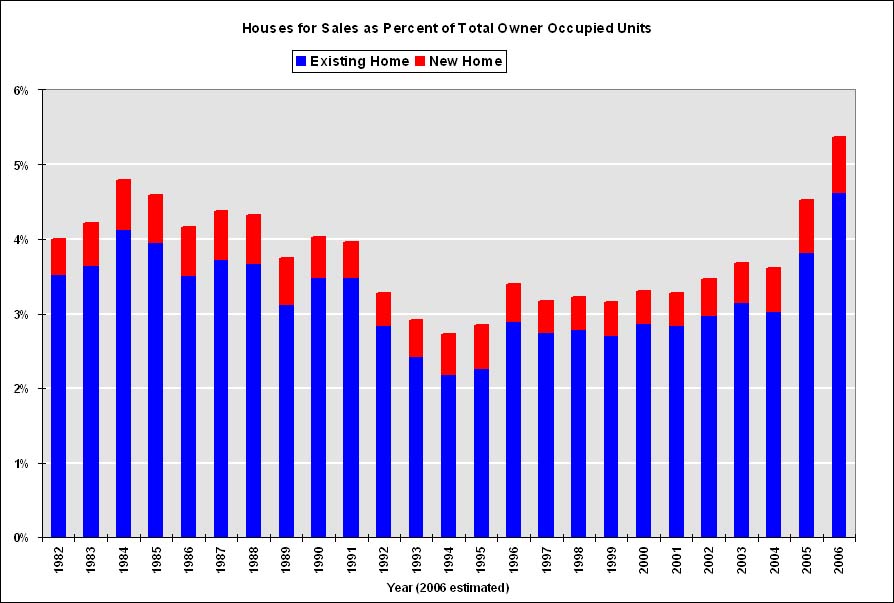 Click on graph for larger image.
This graph shows the total houses for sale (existing and new) as a percent of total owner occupied units. Year 2006 is estimated as 3.5 million existing homes and 0.55 million new homes for sale. Both of these estimates might be low; at the end of November there were 3.82 million existing homes for sales, and if cancellations are included in new home inventory, there are probably close to 0.65 million new homes for sale.
But even with these conservative estimates, 2007 will be starting off with a record number of houses for sale.
2) Households are already dedicating a record percentage of their income to mortgage obligations.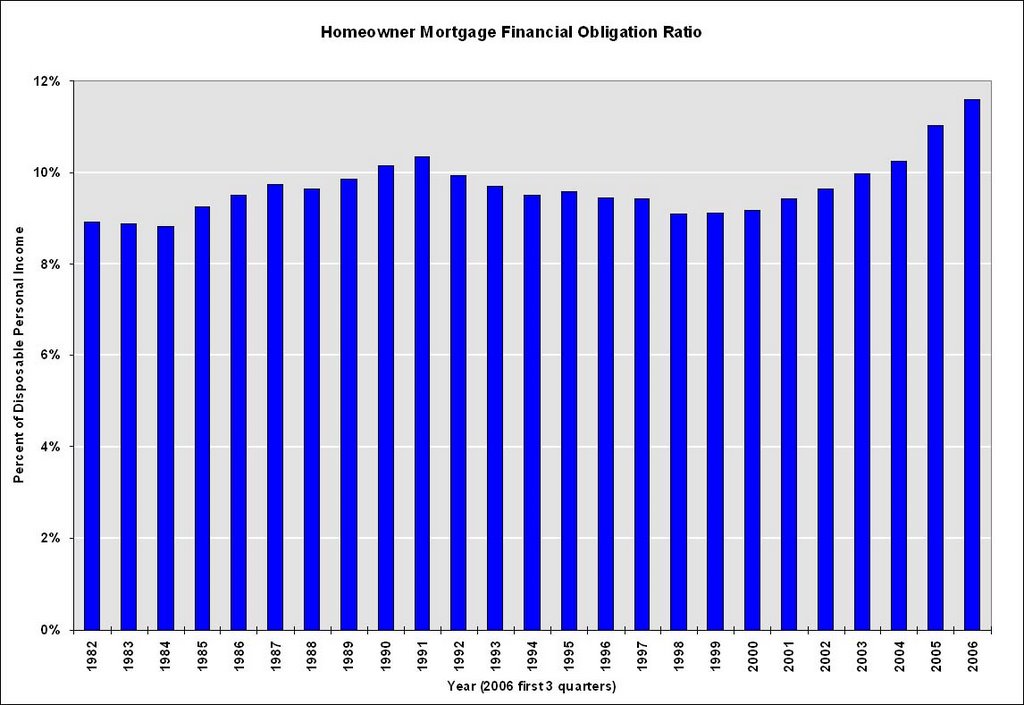 Source: Federal Reserve
As the Fed notes, the important aspect of this series are the changes in household debt service obligations. Even with historically low interest rates, households are already dedicating a record portion of their income to mortgage obligations.
3) Homeowners have a record low percentage of equity in their homes.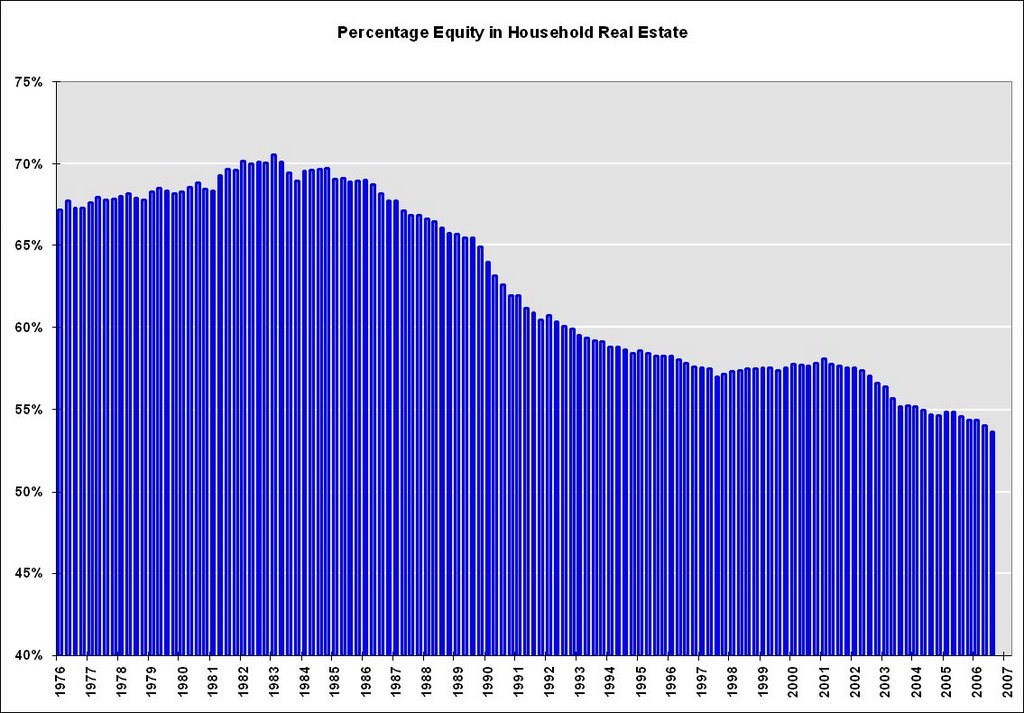 Note: Graph doesn't start at zero to better show change in percent equity.
The Fed recently reported that homeowner equity, as a percent of market value, fell to a record low 53.6%, compared to 54.0% in Q2, and 54.6% one year ago.
This probably indicates that more and more homeowners have maxed out their "home ATM". More on this later.
And now let's add what we're pretty certain will happen:
4) We will see record residential construction job losses in 2007.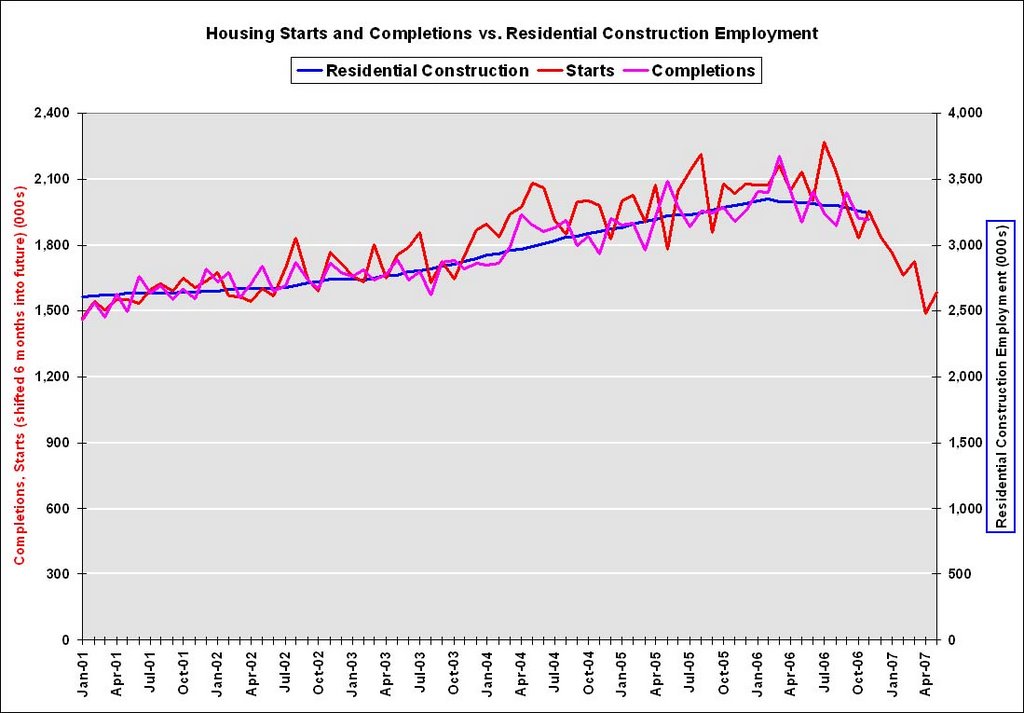
This graph shows starts, completions and residential construction employment. (starts are shifted 6 months into the future). Completions and residential construction employment are highly correlated, and Completions lag Starts by about 6 months.
Based on historical correlations, it is reasonable to expect Completions and residential construction employment to follow Starts "off the cliff". This would indicate the loss of 400K to 600K residential construction employment jobs over the next 6 months.
5) Foreclosures will be approaching record levels in some states. Source: DataQuick through Q3 2006. 2007 estimated at Q4 2006 rate.
This graph shows the number of Notice of Defaults (NODs) filed in California since 1992. Although DataQuick has only released data through Q3, it now appears 2006 will have the highest number of defaults since 1998. At the current pace, 2007 might see a record number of NODs.
Less certain is the amount of overbuilding that occurred in recent years.
6) In earlier posts here and here, I tried to estimate the amount of recent overbuilding. This is important for estimating how far starts might fall in 2007.
Let's put it together and make some predictions for 2007.
A) House Prices will decline: The current record inventory, and the impending foreclosures, will put pressure on prices in 2007. This fits the historical pattern; typically the second year of a housing bust is when prices start to fall. Usually housing busts are local, but since this boom was widespread, the bust will probably be widespread.
I've seen a variety of estimates for 2007. UBS is projecting a 10% price decline in '07. Pimco's Parikh thinks nominal prices will be flat:
"We believe nationwide home prices -- as measured by the federal OFHEO repeat sales index -- will be roughly unchanged in 2007. O.C. prices, on same scale, likely down 5 percent or so. The risk to our price forecast is to the downside."My estimate is prices will fall nominally by 1% to 3% nationwide by all measures (OFHEO, NAR).
The reason for the projection of a small price decline, even with record levels of inventory, is that real estate prices display strong persistence and are sticky downward. So housing "bubbles" typically do not "pop", rather prices deflate slowly in real terms, over several years. Sellers tend to want a price close to recent sales in their neighborhood, and buyers, sensing prices are declining, will wait for even lower prices.
So we have to distinguish between projections for 2007 and the entire bust cycle. As an example, Dr. Thornberg is projecting:
"Whether prices go down or stay the way they are, you can pretty much guarantee that whatever the value of your house now, that's going to be the value of your house in 2011."Over the course of the entire bust, Dr. Gary Shilling expects
"at least a 20% decline in median single-family house prices nationwide, and that number may be way understated."In an efficient market, prices would clear immediately, and we would see the entire price decline in a short period. However since prices are sticky, real estate markets do not clear immediately, and instead we see a drop in transactions, so ...
B) Transactions will decline.
Fannie Mae is projecting existing home sales will fall to 5.925 million units in '07 (from 6.425 million), and new home sales to 0.975 million units (from 1.05 million). I think both numbers might be optimistic.
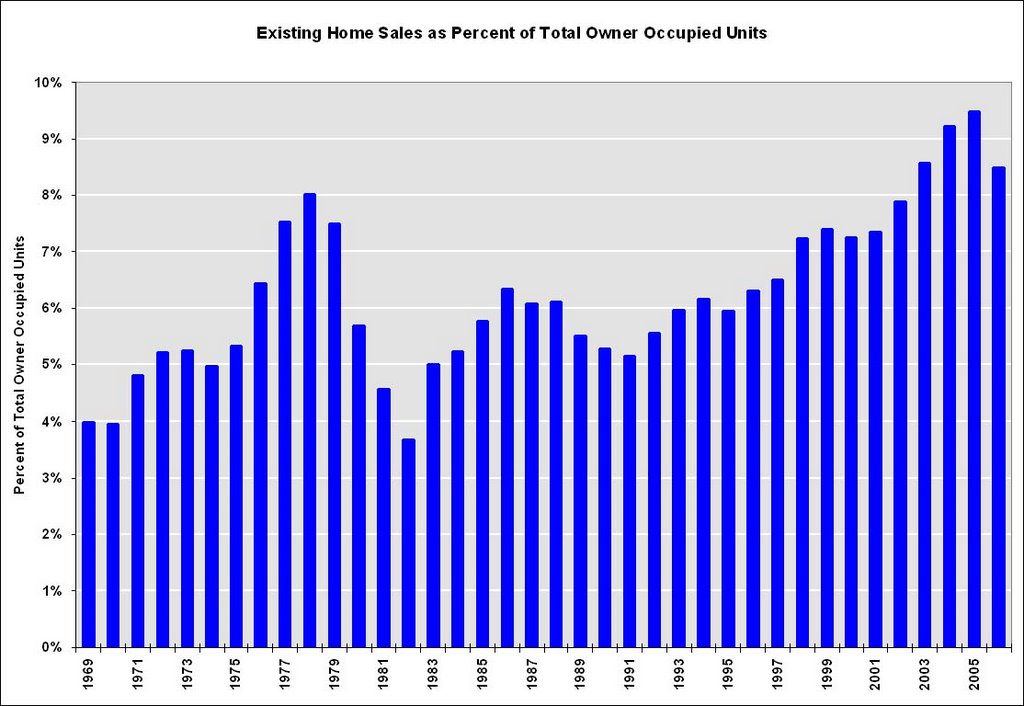 One of the rarely told stories of the housing boom was the jump in turnover of existing homes. This graph shows sales normalized by the number of owner occupied units. This shows the extraordinary level of sales for the last few years, reaching 9.5% of owner occupied units in 2005. The median level is 6.0% for the last 35 years.
Some of the sales were for investment and second homes, but normalizing by owner occupied units probably provides a good estimate of normal turnover. If sales fell back to 6% that would about 4.6 million units. If sales fell back to the level of 1998 to 2001 (7.3% of total owner occupied units sold) that would be about 5.6 million units in 2007.
With falling prices, my guess is existing home sales will "surprise" to the downside, perhaps in the 5.6 to 5.8 million unit range. Based on my estimate of overbuilding in recent years (see point 6 above), I believe new home sales will also surprise to the downside.
C. Mortgage Equity Withdrawal will decline.
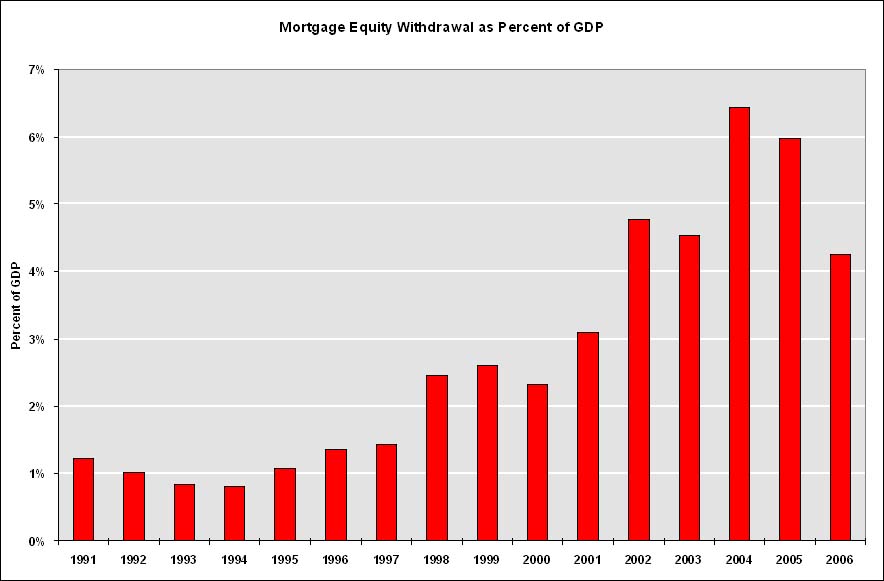 This graph shows Mortgage Equity Withdrawal (MEW) as a percent of GDP, using the Greenspan-Kennedy method.
With stable or falling home prices, already record mortgage obligations, and a record low percentage of equity in their home, MEW will probably be significantly less in 2007. The impact on consumer spending is unclear, but it will be a drag on economic growth.
This gives an overview of the 2007 housing market: falling prices, falling sales, falling residential construction employment, falling starts, falling MEW, falling percentage of equity, and rising foreclosures.
Will this be enough to tip the economy into recession? I still don't know, but I'll make a prediction before the year starts.
ECRI: "Recession is no Longer a Serious Concern"
by Calculated Risk on 12/29/2006 11:17:00 AM
From Reuters: Gauge of U.S. economy falls in latest week
The Economic Cycle Research Institute ... said its Weekly Leading Index slipped to 138.5 in the week ending Dec. 22 from 139.7 in the prior week, due to higher interest rates and more jobless claims.And from Bloomberg: On consumer confidence
However, annualized growth in the week ended Dec. 22 rose to 3.8 percent from 3.4 percent in the prior period, a reading not reached since last February.
"Given the steady improvement in the WLI, recession is no longer a serious concern," said Lakshman Achuthan, managing director at ECRI.
"This really just points to the fact that the economy is experiencing a soft landing and no recession," said Lynn Franco, director of the Conference Board's Consumer Research Center, in an interview. "It speaks volumes about the resiliency of the consumer."Other than a few economists, the overwhelming consensus view is for a soft landing and GDP growth of 2.5% to 3.0% in 2007.
Thursday, December 28, 2006
November Existing Home Sales
by Calculated Risk on 12/28/2006 10:54:00 AM
The National Association of Realtors (NAR) reports: November Existing-Home Sales Rise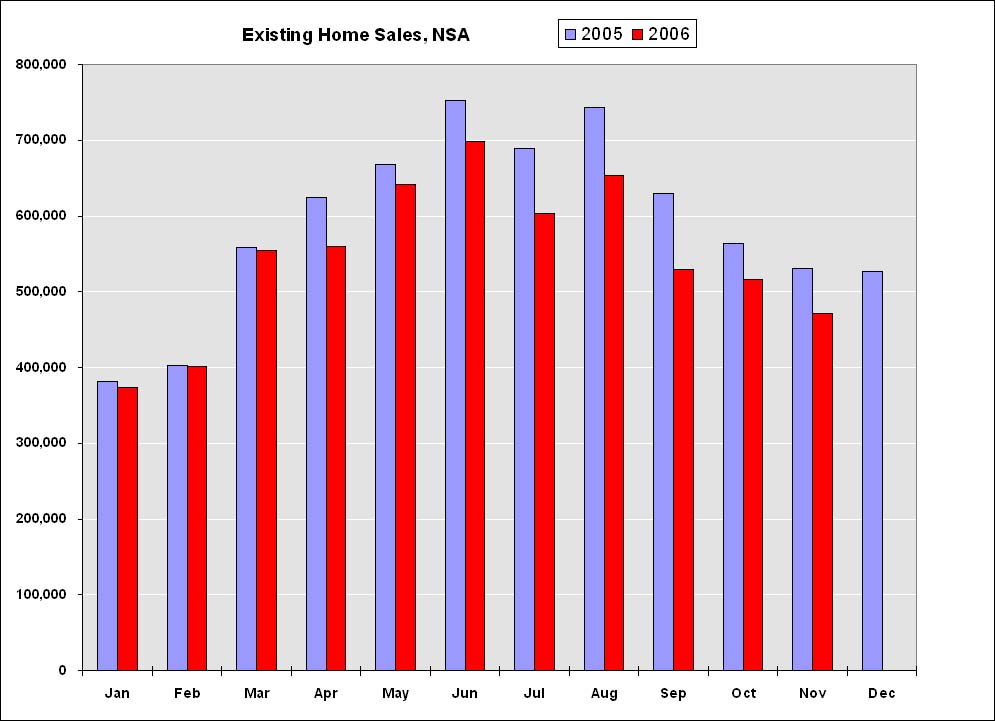 Click on graph for larger image.
Total existing-home sales – including single-family, townhomes, condominiums and co-ops – rose 0.6 percent to a seasonally adjusted annual rate of 6.28 million units in November from a level of 6.24 million in October, but were 10.7 percent below the 7.03 million-unit pace in November 2005.The above graph shows NSA monthly sales for 2005 and 2006. On an NSA basis, sales were 11.1% below November 2005.

Total housing inventory levels fell 1.0 percent at the end of November to 3.82 million existing homes available for sale, which represents a 7.3-month supply at the current sales pace.
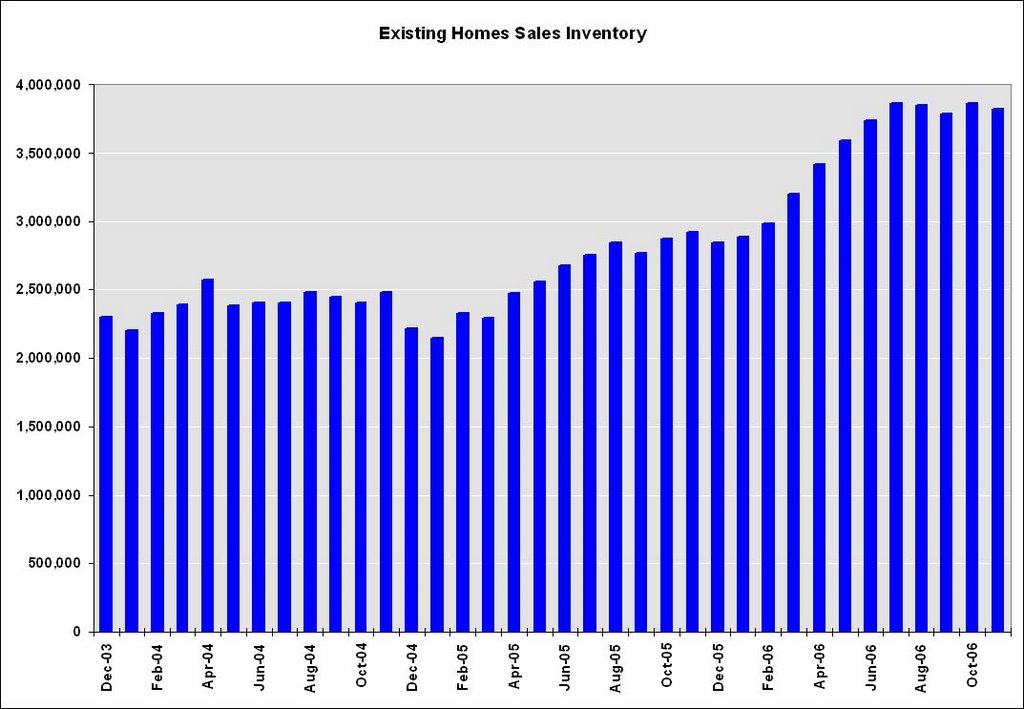 As I've noted before, usually 6 to 8 months of inventory starts causing pricing problems and over 8 months a significant problem. With current inventory levels at 7.4 months of supply, inventories are now well into the danger zone and prices are falling in most regions. Nationwide prices were off 3.1% from November 2005.
Wednesday, December 27, 2006
GDP Growth: With and Without Mortgage Equity Withdrawal
by Calculated Risk on 12/27/2006 01:11:00 PM
UPDATE: Please be sure to see this later post explaining this graph. The graph is accurate, but can be misleading, and several commentators have described the graph incorrectly. The impact of MEW isn't cumulative, and looking at the graph I can see how people thought it was (so I've discontinued using the graph)..
Original post deleted because of confusion. See the above link for the graph.
More on November New Home Sales
by Calculated Risk on 12/27/2006 12:07:00 PM
Please see the previous post: November New Home Sales Click on graph for larger image.
One of the most reliable economic leading indicators is New Home Sales.
New Home sales were falling prior to every recession of the last 35 years, with the exception of the business investment led recession of 2001. This should raise concerns about a possible consumer led recession in the months ahead.
Some more optimistic observers will argue that sales have fallen back to a sustainable level after the excesses of 2004 and 2005. Others will argue that sales have to fall more in coming years, to make up for the excesses of recent years. That is one of the reasons 2007 will be such an interesting year.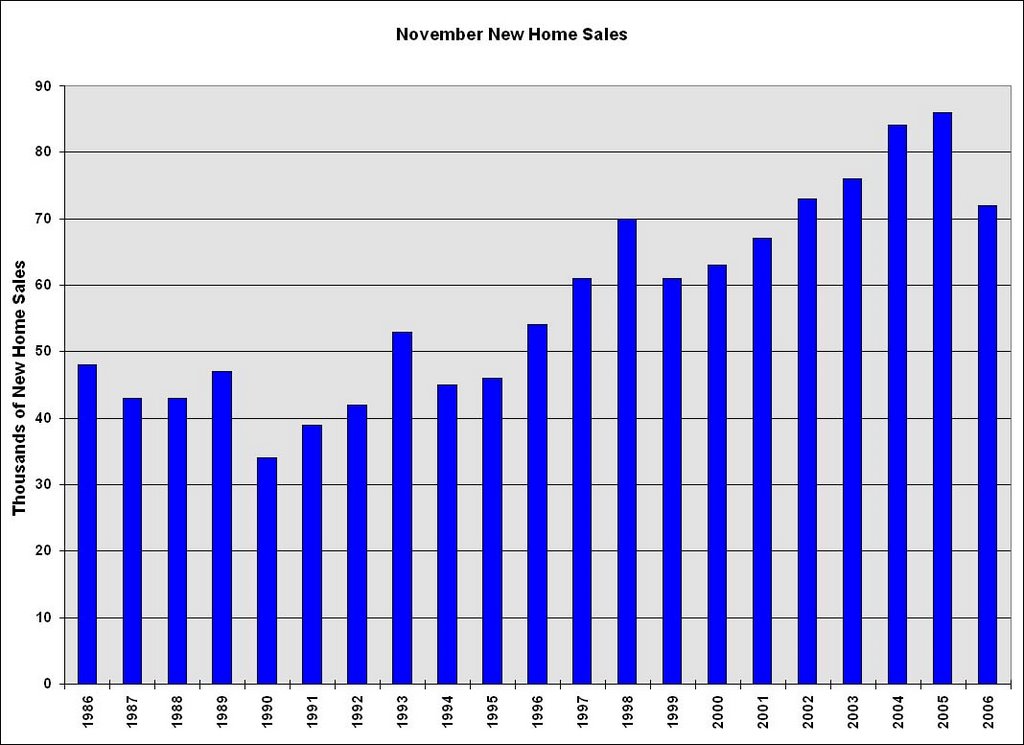
The second graph shows November New Home sales for the last 20 years. The recent sharp drop in sales is similar to the decrease at the start of the 1990s housing bust.
Also note that November sales have fallen below the 2002 levels.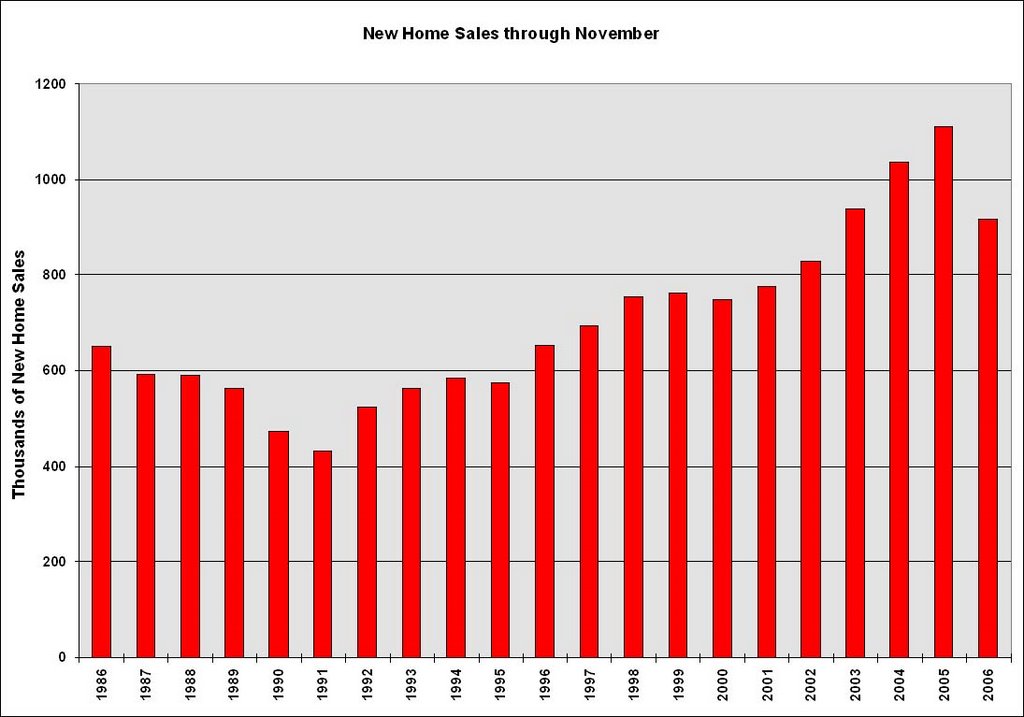
The third graph shows YTD New Home sales through November. It now appears that 2006 will finish as the 4th best year behind 2003.
Sales for the most recent months have fallen to the 2002 level. Fannie Mae is currently estimating that sales for 2007 and 2008 will be at the 2002 level (about 975K units). I think sales will fall further, perhaps to the level of the 1998 through 2001 period, or about 900K units in 2007.
November New Home Sales: 1.047 Million SAAR
by Calculated Risk on 12/27/2006 10:24:00 AM
According to the Census Bureau report, New Home Sales in November were at a seasonally adjusted annual rate of 1.047 million. Sales for October were revised up to 1.013 million, from 1.004 million. Numbers for August and September were also revised up slightly too. 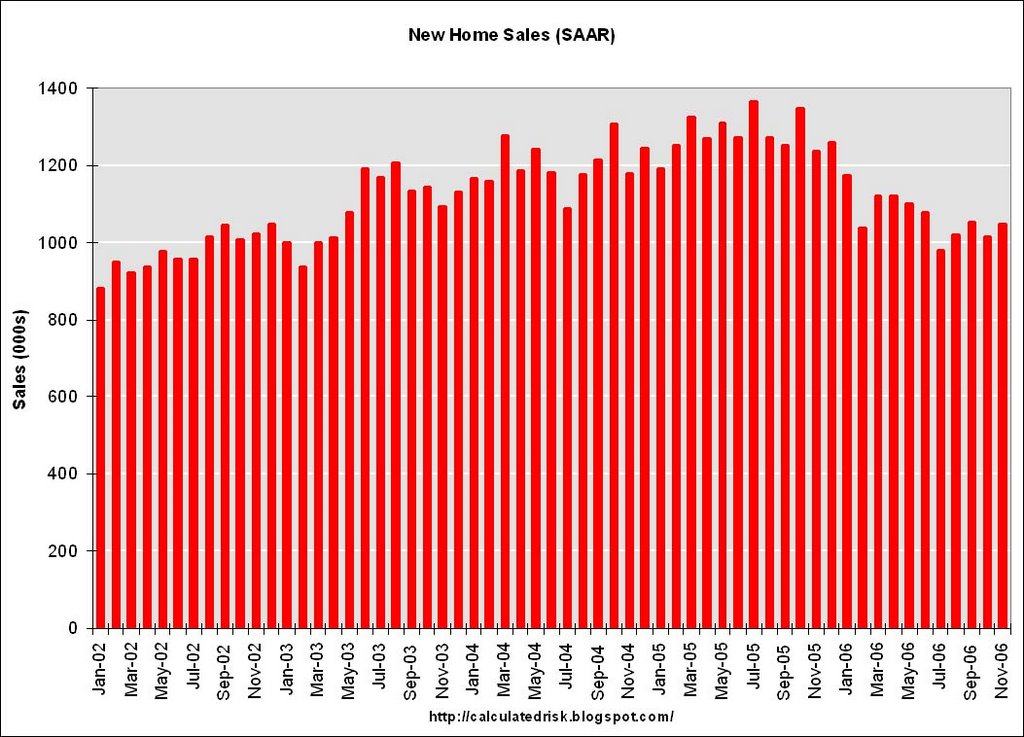
Click on Graph for larger image.
Sales of new one-family houses in November 2006 were at a seasonally adjusted annual rate of 1,047,000, according to estimates released jointly today by the U.S. Census Bureau and the Department of Housing and Urban Development. This is 3.4 percent above the revised October rate of 1,013,000, but is 15.3 percent below the November 2005 estimate of 1,236,000.
The Not Seasonally Adjusted monthly rate was 72,000 New Homes sold. There were 86,000 New Homes sold in November 2005.
On a year over year NSA basis, November 2006 sales were 16.3% lower than November 2005. Also, November '06 sales were below November 2004 (84,000) and November 2003 (76,000) sales.
This is the lowest November since 2001 when 67,000 new homes were sold.
The median and average sales prices were mixed. Caution should be used when analyzing monthly price changes since prices are heavily revised.
The median sales price of new houses sold in November 2006 was $251,700; the average sales price was $294,900.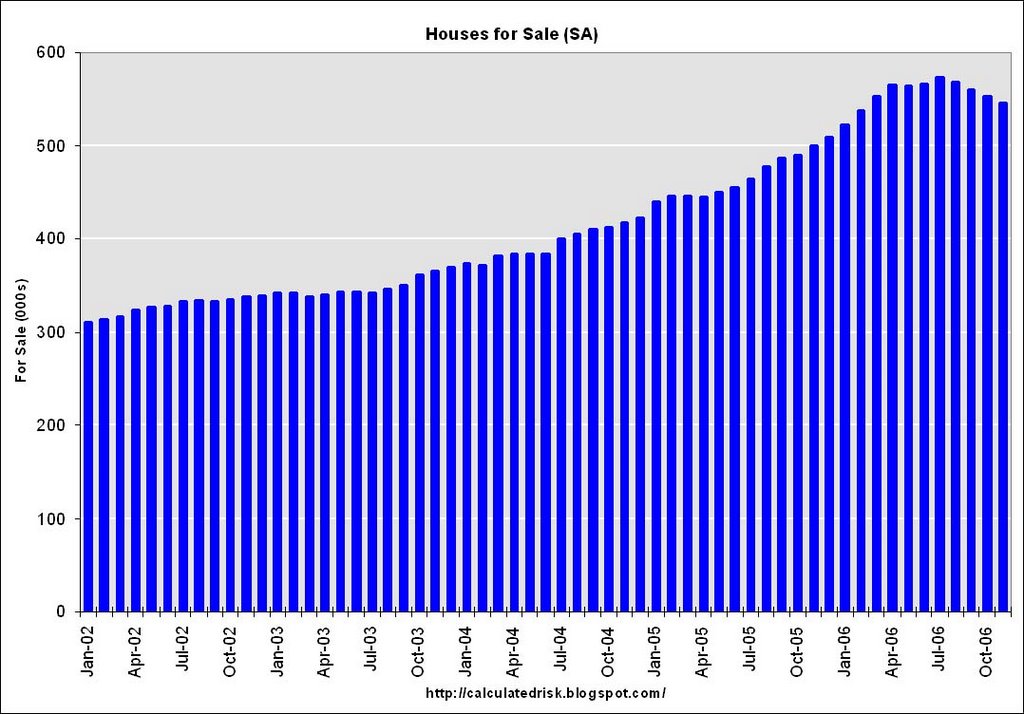
The seasonally adjusted estimate of new houses for sale at the end of November was 545,000.
The 545,000 units of inventory is slightly below the levels of the last six months. Inventory numbers from the Census Bureau do not include cancellations - and cancellations are at record levels. Actual New Home inventories are much higher - some estimate about 20% higher.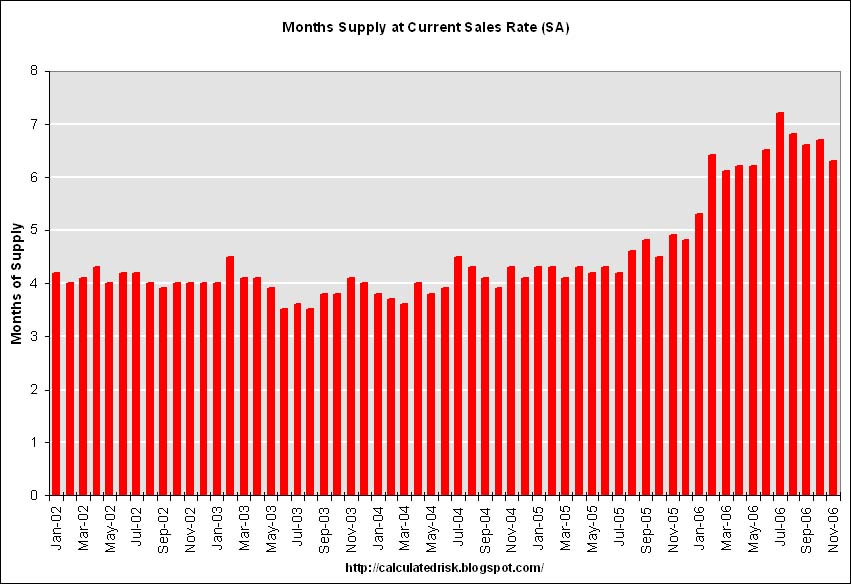 This represents a supply of 6.3 months at the current sales rate.
On a months of supply basis, inventory is above the level of recent years.
More later today on New Home Sales.


