 RSS Feed
 by Calculated Risk on 11/20/2006 11:38:00 AM
Monday, November 20, 2006
Morgan Stanley's Roach: Two-Engine Slowdown
Stephen Roach, Chief Economist of Morgan Stanley, writes: Two-Engine Slowdown
"The US and Chinese economies are slowing sharply as 2006 comes to an end. Inasmuch as these two engines have accounted for about two-thirds of the cumulative increase in world GDP over the past five years, this two-engine slowdown can hardly be taken lightly. In my view, it poses major downside risks to the global soft-landing call embedded in liquidity-driven financial markets."Please read his piece for the details. Roach concludes:
"As I put this all together, I continue to believe that global growth will fall well short of consensus expectations in 2007. The IMF’s forecast of another year of 4.9% world GDP growth in 2007 -- identical to the trends of the past four years and the strongest surge in global activity since the early 1970s -- is very much in line with what I hear from the broad consensus of investors I meet with around the world. Implicit in this view is that nothing can stop the American consumer or the Chinese producer -- conclusions that are both being drawn into sharp question in the final months of 2006. With slowdowns in the US and China likely to have a meaningful impact on two-thirds of the global growth dynamic, the burden of proof for the case for global resilience has shifted to the decoupling crowd. The sharp -2.8% annualized decline in Japanese consumption in the third quarter of CY06, together with recent disappointing trade date from Taiwan and Korea, do not exactly bode well for the decoupling case.
There’s one word that permeates virtually every discussion I have with investors around the world -- liquidity. It’s literally the only thing they want to talk about. In the view of most fund managers, liquidity remains more than ample to support ever-frothy markets -- irrespective of the outcome for the global economy. I continue to suspect that this disconnect between the global growth and liquidity cycles will be resolved one way or another in 2007. For my money, the risks of the “global fizzle” are being taken far too lightly."
Saturday, November 18, 2006
Q&A with Professor Thornberg on Housing
by Calculated Risk on 11/18/2006 03:07:00 PM
From the OC Register Insider Q&A: Economist Chris Thornberg. Here are some excerpts: Q. Do you have a firm projection of, say, 2007 price movements?
A. There is no such thing as firm projection. But all in all there are two scenarios. The first is that the rest of the economy keeps chugging ahead and the market is stabilized by job and income growth. Price growth remains at zero. This is the good scenario. The bad is that the rest of the economy also cools, and prices fall. But don't expect that prices will collapse by, say, 30%. Housing markets aren't that liquid. Declines will be moderate.
...
Q. What might change your outlook -- good or bad?
A. The key is consumer spending. If people respond to a cooling in housing prices by cutting back on home spending it could get ugly out there in the rest of the economy very quickly. This would turn a bad housing market into an abysmal one. I don't see much upside for the next few years regardless of what may happen.
Friday, November 17, 2006
RealtyTrac: Foreclosures Pass 1 Million for 2006
by Calculated Risk on 11/17/2006 06:19:00 PM
RealtyTrac reports: Foreclosures Surpass 1 Million Mark in October
“So far this year more than 1 million properties have entered some stage of foreclosure nationwide, up 27 percent from the same time last year. ... Our data from the last three months shows that foreclosures are definitely trending upward...”Check the report for your state.
James J. Saccacio, chief executive officer of RealtyTrac.
Here is a table from an earlier post on default notices in California (source: DataQuick):
| California Default Notices, Source: DataQuick | |
| Year | Default Notices |
| 1992 | 100,573 |
| 1993 | 121,416 |
| 1994 | 122,530 |
| 1995 | 135,713 |
| 1996 | 162,597 |
| 1997 | 141,180 |
| 1998 | 122,775 |
| 1999 | 101,053 |
| 2000 | 88,666 |
| 2001 | 81,003 |
| 2002 | 78,784 |
| 2003 | 66,127 |
| 2004 | 52,674 |
| 2005 | 54,476 |
| 2006 (through Q3) | 66,185 |
There were 26,705 default notices sent to California homeowners in Q3. At that pace, the number of default notices sent in 2006 would be the highest since 1999 (66,185 through Q3 + 26,705 = 92,890).
That projection now seems optimistic. RealtyTrac shows 13,601 default notices sent to California homeowners in October alone (half of my Q4 estimate in one month).
The rapid increase in foreclosure activity, combined with falling home prices and a weakening California economy, lead me to believe there will be a record number of default notices sent to California homeowners in 2007, surpassing the previous record of 162,597 in 1996.
Note that 1996 was the last year of the previous housing bust in California. The bust lasted over 6 years. Next year will only be the second year of the current bust.
Housing: Starts and Completions
by Calculated Risk on 11/17/2006 10:05:00 AM
The Census Bureau reports on housing Permits, Starts and Completions. Permits are falling:
Privately-owned housing units authorized by building permits in October were at a seasonally adjusted annual rate of 1,535,000. This is 6.3 percent below the revised September rate of 1,638,000 and is 28.0 percent below the October 2005 estimate of 2,131,000.Starts are falling:
Privately-owned housing starts in October were at a seasonally adjusted annual rate of 1,486,000. This is 14.6 percent below the revised September estimate of 1,740,000 and is 27.4 percent below the October 2005 rate of 2,046,000.And Completions are still just below record levels:
Privately-owned housing completions in October were at a seasonally adjusted annual rate of 1,953,000. This is 3.8 percent below the revised September estimate of 2,031,000 and is 0.7 percent below the October 2005 rate of 1,967,000.
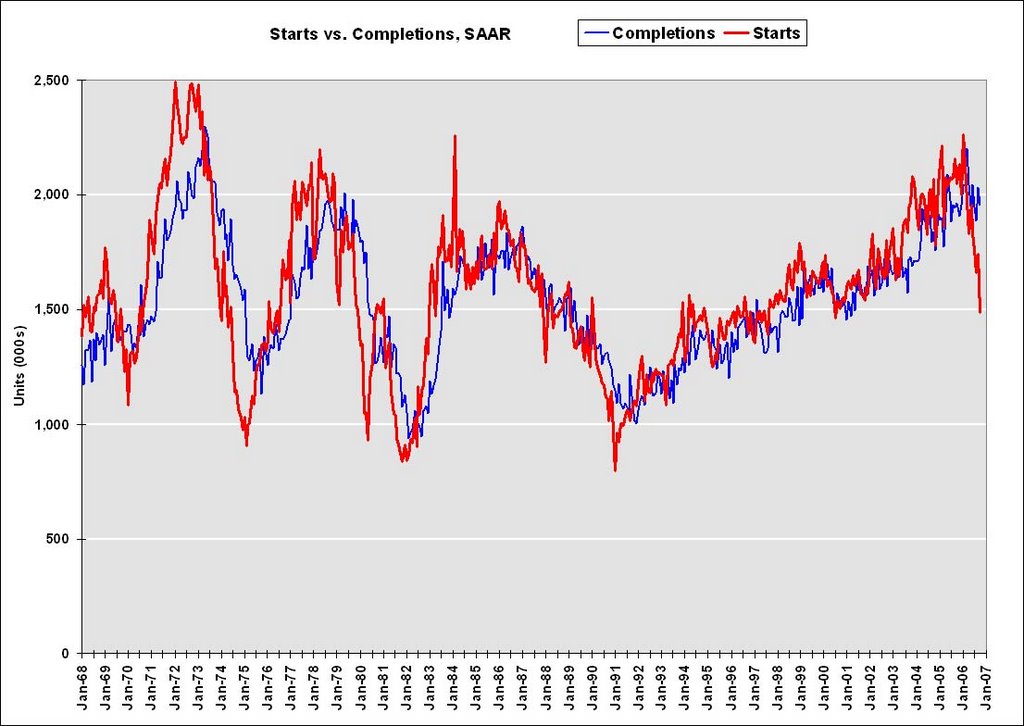 Click on graph for larger image.
The first graph shows Starts vs. Completions.
Starts have fallen "off a cliff", but completions have just started to fall.

This graph shows starts, completions and residential construction employment. (starts are shifted 6 months into the future). Completions and residential construction employment are highly correlated, and Completions lag Starts by about 6 months.
Based on historical correlations, it is reasonable to expect Completions and residential construction employment to follow Starts "off the cliff". This would indicate the loss of 400K to 600K residential construction employment jobs over the next 6 months.
Thursday, November 16, 2006
Seven States Adopt CSBS Nontraditional Mortgage Guidance
by Calculated Risk on 11/16/2006 08:21:00 PM
The Conference of State Bank Supervisors (CSBS) and the American Association of Residential Mortgage Regulators (AARMR) have announced that seven states have agreed to adopt the new Nontraditional Mortgage Guidance.
The CSBS has created a web page to track the states that have adopted the Guidance. The seven states so far are: Georgia, Idaho, Iowa, Massachusetts, Montana, New Hampshire, and Wyoming.
Here is a typical announcement:
Industry Letter Regarding Guidance on Nontraditional Mortgage Product Risks
--------------------------------------------------------------------------------
By the Division of Banks
November 14, 2006
SUBJECT: REGULATORY BULLETIN 5.1-103
GUIDANCE ON NONTRADITIONAL MORTGAGE PRODUCT RISKS
To the Chief Executive of the Licensee Addressed:
The purpose of this letter is to inform you of the Division of Banks’ (the "Division") intention to issue Regulatory Bulletin 5.1-103 (the "Bulletin"), applicable to licensed mortgage lenders and mortgage brokers, and to provide licensed entities with a copy of the proposed Bulletin in advance of its issuance by the Division. The proposed Bulletin sets forth the Division’s policy relative to Guidance on Nontraditional Mortgage Product Risks.
On October 4, 2006, the Office of the Comptroller of the Currency, the Board of Governors of the Federal Reserve System, the Federal Deposit Insurance Corporation, the Office of Thrift Supervision, and the National Credit Union Administration (the "Agencies") issued an interagency guidance relative to nontraditional mortgage product risks. This interagency guidance applies to all banks and their subsidiaries, bank holding companies and their nonbank subsidiaries, savings associations and their subsidiaries, savings and loan holding companies and their subsidiaries, and credit unions.
Recognizing that the federal interagency guidance does not cover a majority of loan originations in the Commonwealth, the Division, in cooperation with the Conference of State Bank Supervisors ("CSBS"), has developed parallel guidance for licensed mortgage brokers and mortgage lenders in this state. The Division strongly supports the purpose of the guidance adopted by the Agencies and is committed to promote the uniform application of consumer protections for all borrowers.
This Bulletin is intended to promote consistent regulation in the mortgage market and clarify how licensed mortgage brokers and mortgage lenders (referred to as "providers") can offer nontraditional mortgage products in a way that clearly discloses the risks that borrowers may assume.
In order to maintain regulatory consistency, this guidance substantially mirrors the interagency guidance, except for the deletion of sections not applicable to non-depository institutions.
The Division is pleased to accept comments on the Bulletin from interested parties which should be submitted by December 4, 2006 via email to dob.comments@state.ma.us or by mail addressed to Steven L. Antonakes, Commissioner of Banks, One South Station, Boston, MA 02110.
Very truly yours,
Steven L. Antonakes
Commissioner of Banks
DataQuick: California Sales Lowest Since 1997
by Calculated Risk on 11/16/2006 02:58:00 PM
DataQuick reports: California October Home Sales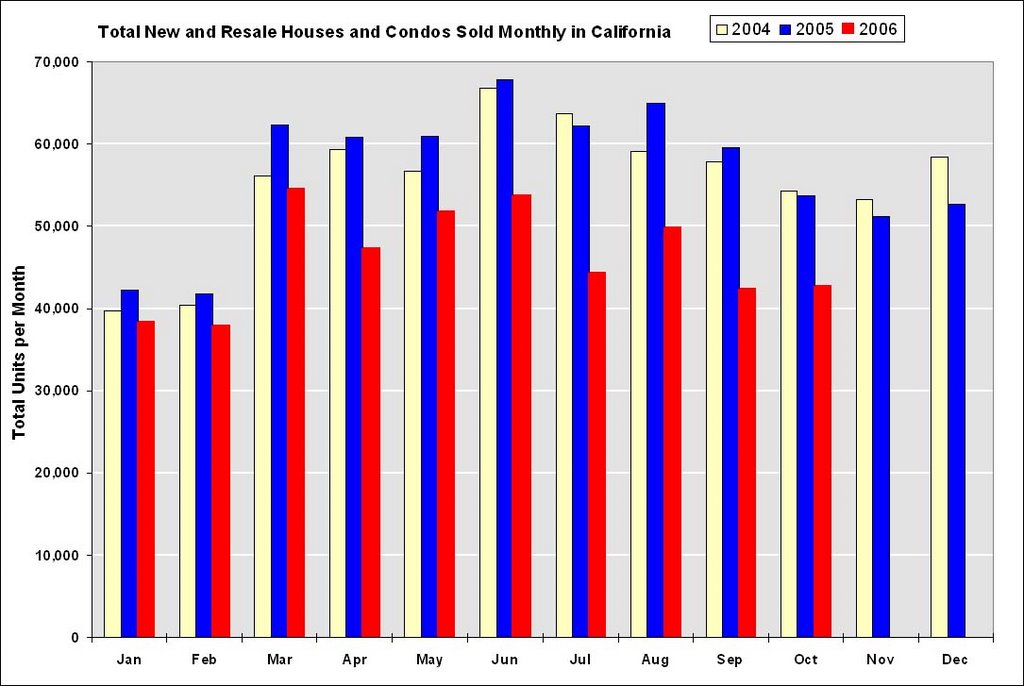 Click on graph for larger image.
A total of 42,750 new and resale houses and condos were sold statewide last month. That's up 0.7 percent from 42,450 for September and down 21.7 percent from a 54,600 for October 2005.Although some areas are already seeing YoY nominal price declines (San Diego, Ventura, Contra Costa), the median YoY price in California increased slightly.
Last month's sales made for the slowest October since 1997 when 41,850 homes were sold.
The median price paid for a home last month was $467,000. That was up 0.2 percent from September's $466,000, and up 2.9 percent from $454,000 for October a year ago.
NAHB: Builder Confidence Improves in November
by Calculated Risk on 11/16/2006 02:26:00 PM
From NAHB: Builder Confidence Improves in November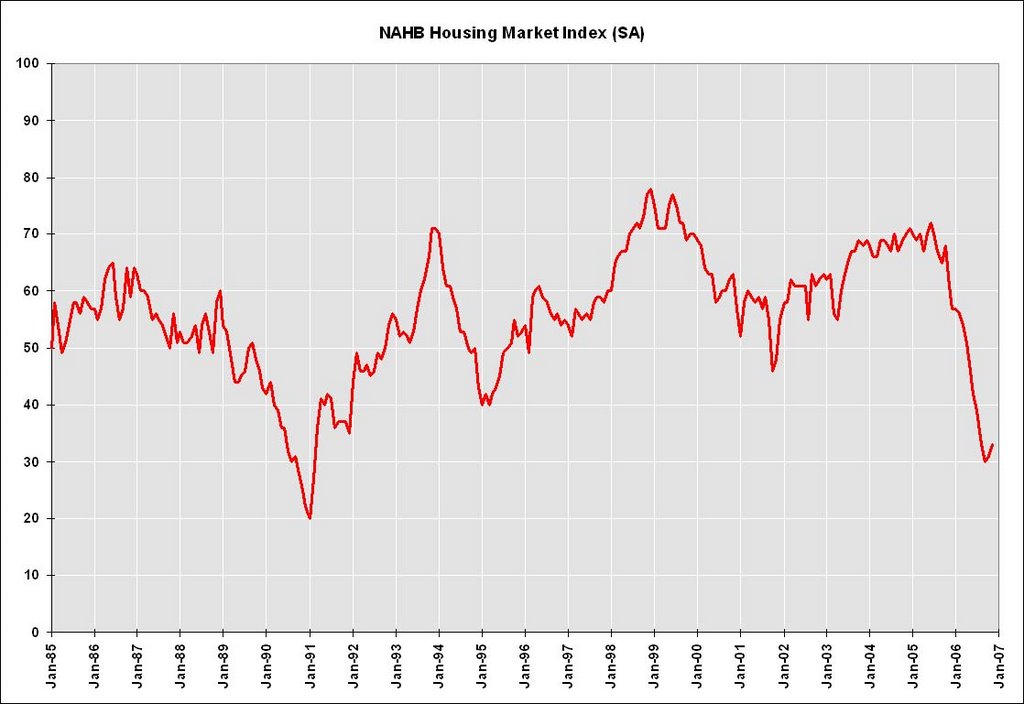 Click on graph for larger image.
... home builder confidence in November edged up for the second consecutive month, according to the National Association of Home Builders/Wells Fargo Housing Market Index (HMI), released today. The HMI gained two points from the previous month to stand at 33.
...
Derived from a monthly survey that NAHB has been conducting for almost 20 years, the NAHB/Wells Fargo HMI gauges builder perceptions of current single-family home sales and sales expectations for the next six months as “good,” “fair” or “poor.” The survey also asks builders to rate traffic of prospective buyers as either “high to very high,” “average” or “low to very low.” Scores for each component are then used to calculate a seasonally adjusted index where any number over 50 indicates that more builders view sales conditions as good than poor.
All three component indexes moved higher in November, including a one-point gain in the current sales index, to 33. The component gauging sales expectations for the next six months rose four points to 46 and the component gauging traffic of prospective buyers moved up three points from last month, to 26.
...
On a regional basis, the HMI for builders in the Northeast rose two points to 37 and posted a two-point gain in the South, to 40. The HMI for builders in the Midwest and West declined by two points to 16, and by one point to 34, respectively.
Inflation
by Calculated Risk on 11/16/2006 12:28:00 PM
The following graph shows monthly CPI, Core CPI (CPI less food and energy) and median CPI from the Cleveland Fed.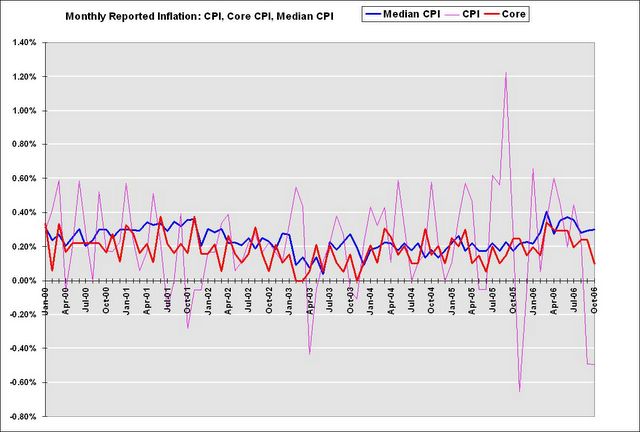 Click on graph for larger image.
Monthly CPI is a very noisy series and that is why many people use Core CPI. Personally I prefer the Cleveland Fed's median CPI. For October, the median CPI increased 0.3% or at an annualized rate of 3.65%.
Over the last 12 months, the median CPI has increased 3.6%, and over the last 6 months, median CPI has increased at a 4.0% annualized rate. Although the inflation news is welcome, I don't think the CPI or PPI numbers will change the Fed's view.
For more, see Kash's Inflation Update, October 2006
UK: Banks told to predict effects of a 40% crash in house prices
by Calculated Risk on 11/16/2006 01:14:00 AM
From The Times: Banks told to predict effects of a 40% crash in house prices (hat tip: Kevin)
BANKS in the UK have been ordered by financial regulators to assess how they would cope in the event of house prices crashing by 40 per cent.And from the Business Online: House prices most overvalued since 1948
...
The FSA said yesterday that an “appropriate” benchmark was to assume property prices fell by 40 per cent and that 35 per cent of mortgages in default ended with homes being re-possessed. It stressed that this was not a forecast but a “severe but plausible scenario” and one that banks should examine when deciding how robust their balance sheets were.
...
[Clive Briault, the FSA’s managing director for retail markets] warned bankers to ensure that they have properly stress-tested their mortgage portfolios in the wake of decisions by some to lend people greater multiples of their incomes.
...
House prices fell about 15 per cent nationwide in 1989-1992, and in parts of East Anglia by 40 per cent, leading to repossessions, write-downs and bank losses.
...
The FSA move came as UK house prices grew at their fastest for four years, according to new figures from RICS.
BRITAIN’S housing market is more overvalued than at any time since 1948 as buyers compete to snap up scarce properties, according to Dresdner Kleinwort.
The research will fuel fears that easy credit is inducing buyers to pay too much when buying their homes and over-stretch themselves financially.

The ratio of house prices to disposable incomes typically peaks at more than six times, the analysis reveals. On this measure, peaks in the housing market were seen in 1948, 1973, 1988 and 2006.
The current ratio is higher than in all previous episodes apart from 1948, when private homes were very scarce after the second world war.
David Owen, an economist at Dresdner Kleinwort, said: “There was an earlier period when inflation and interest rates were both low and the UK housing market was as expensive as it is today: the late 1940s. As in other housing corrections house prices then fell in real terms by over 30%. They also fell in nominal terms.”
After each previous peak, house prices went on to fall sharply in real terms, usually by more than 30%.
Wednesday, November 15, 2006
DataQuick: Bay Area home sales slow, prices flat
by Calculated Risk on 11/15/2006 05:10:00 PM
DataQuick reports: Bay Area home sales slow, prices flat
Bay Area home sales held steady at a five-year low in October ... Prices remained flat.
The median price paid for a Bay Area home was $614,000 last month, up 0.5 percent from September's $611,000, and unchanged from October last year. The median hovered around $630,000 last spring and early summer, and spiked to $644,000 in June before coming down.
| Bay Area California Median Home Prices | ||||
| Area | Oct '04 | Oct '05 | Oct '06 | Pct Change |
| Alameda | $497K | $571K | $578K | 1.2% |
| Contra Costa | $468K | $575K | $544K | -5.4% |
| Marin | $688K | $817K | $844K | 3.3% |
| Napa | $527K | $608K | $555K | -8.7% |
| San Francisco | $666K | $778K | $771K | -0.9% |
| San Mateo | $656K | $759K | $745K | -1.8% |
| Santa Clara | $552K | $639K | $658K | 3.0% |
| Solano | $413K | $476K | $462K | -2.9% |
| Sonoma | $477K | $564K | $531K | -5.9% |
| Bay Area | $524K | $614K | $614K | 0.0% |
I added the October 2004 median prices to give a two year perspective on prices.
A total of 7,979 new and resale houses and condos were sold in the nine-county region in October. That was up 0.9 percent from 7,907 for the month before, and down 24.1 percent from 10,508 for October last year, according to DataQuick Information Systems.
Last month's sales count was the lowest for any October since 2001 when 7,867 homes were sold. An average October has 8,445 sales in DataQuick's statistics, which go back to 1988. The range is from 5,767 in 1994 to 11,728 in 2003.
| Bay Area California Homes Sold | ||||
| Area | Oct '04 | Oct '05 | Oct '06 | Pct Change |
| Alameda | 2,458 | 2,187 | 1,586 | -27.5% |
| Contra Costa | 2,252 | 2,104 | 1,658 | -21.2% |
| Marin | 404 | 395 | 286 | -27.6% |
| Napa | 206 | 187 | 140 | -25.1% |
| San Francisco | 650 | 605 | 523 | -13.6% |
| San Mateo | 840 | 754 | 653 | -13.4% |
| Santa Clara | 2,595 | 2,557 | 1,971 | -22.9% |
| Solano | 978 | 936 | 605 | -35.4% |
| Sonoma | 797 | 783 | 557 | -28.9% |
| Bay Area | 11,180 | 10,508 | 7,979 | -24.1% |

In Memoriam: Doris "Tanta" Dungey


| Privacy Policy |
| Copyright © 2007 - 2023 CR4RE LLC |