 RSS Feed
 by Calculated Risk on 8/17/2006 11:33:00 AM
Thursday, August 17, 2006
Good News: Initial Claims and Oil
Here is some good news. A few weeks ago, Bernanke expressed concern about initial claims rising:
"Gains in payroll employment in recent months have been smaller than their average of the past couple of years, and initial claims for unemployment insurance have edged up. These developments are consistent with the softening in the pace of overall economic activity that seems to be under way."I presented a graph of initial claims at that time.
 Click on graph for larger image.
Here is an updated graph of initial claims for unemployment insurance (four week average) including the Labor Department's report today.
Initial claims have been steady for the last couple of months.
And on oil: There was a brief increase in the spot price of oil to $78 per barrel, earlier this month, after BP announced a major Alaskan field shutting down. Since then, the news had improved and the price of crude oil has fallen almost ten percent: Good news triggers oil price fall
Oil prices have fallen to their lowest level in nearly two months as the continuing ceasefire in Lebanon and healthy US stockpiles calmed markets.Jobs are the key to achieving some sort of soft landing, so the trend in initial claims is definitely good to see. Unfortunately, I think the layoffs in housing related fields have just starting.
Traders said BP's decision to continue oil production from parts of its Prudhoe Bay field in Alaska had also triggered the price movement.
Brent crude was trading down 97 cents at $71.86 a barrel while US light, sweet crude slid $1.12 to $70.77.
Despite the drop, prices are still 14% higher for the year as a whole.
...
A series of positive developments in recent days have boosted sentiment, which had previously been hit by the conflict in Lebanon, kidnappings of foreign oil workers in Nigeria and BP's problems. The troubles had sent Brent prices to a record high above $78 a barrel.
Some of the factors and disruptions that helped drive us to very high levels have been resolved now
...
On Wednesday, the US energy department reported higher-than-expected oil inventories of 331 million barrels.
Stockpiles fell by 1.6 million barrels in the week ending 11 August but the reduction was less than expected given the closure of part of Prudhoe Bay, the largest oil field in the US, due to pipe corrosion.
Inventories remain at almost their highest level since 1999.
And falling oil prices are welcome news and will hopefully offset some of the impact from the housing bust. Two pieces of good news today.
Wednesday, August 16, 2006
Bay Area: Housing Sales at Ten Year Low
by Calculated Risk on 8/16/2006 02:33:00 PM
DataQuick reports: Bay Area home sales decline
Home sales in the Bay Area slowed to their lowest level in ten years as prices increased at their slowest pace since spring 2003, a real estate information service reported.And on prices
A total of 7,941 new and resale houses and condos were sold in the nine-county region last month. That was down 19.1 percent from 9,892 for June, and down 30.8 percent from 11,470 for July last year, according to DataQuick Information Systems.
Last month was the slowest July since 1996 when 7,682 homes were sold. The average July sales count since 1988 is 9,158.
The median price paid for a Bay Area home was $627,000 last month. That was down 2.6 percent from June's record $644,000, and up 3.5 percent from $606,000 for July a year ago. Last month's year-over- year increase was the lowest since May 2003 when the $427,000 median was up 3.4 percent.Note that prices in San Francisco, San Mateo and Marin are down slightly YoY. This is probably the beginning of price declines.
MBA: Refinance Applications Increase
by Calculated Risk on 8/16/2006 09:49:00 AM
The Mortgage Bankers Association (MBA) reports: Refinance Applications Increase 
Click on graph for larger image.
The Market Composite Index, a measure of mortgage loan application volume, was 561.2, an increase of 1.4 percent on a seasonally adjusted basis from 553.3 one week earlier. On an unadjusted basis, the Index increased 0.4 percent compared with the previous week but was down 25.6 percent compared with the same week one year earlier.Mortgage rates increased slightly:
The seasonally-adjusted Purchase Index decreased by 0.8 percent to 385.9 from 388.9 the previous week and the Refinance Index increased by 4.6 percent to 1587.5 from 1518.1 one week earlier.
The average contract interest rate for 30-year fixed-rate mortgages increased to 6.54 percent from 6.45 percent ...Change in mortgage applications from one year ago (from Dow Jones):
The average contract interest rate for one-year ARMs increased to 5.97 percent from 5.96 percent ...
| Total | -25.6% |
| Purchase | -21.9% |
| Refi | -30.5% |
| Fixed-Rate | -23.7% |
| ARM | -29.9% |
Purchase activity continues to fall, and has declined 21.9% compared to the same period last year.
Tuesday, August 15, 2006
Housing: Inverted Reasoning?
by Calculated Risk on 8/15/2006 04:25:00 PM
Housing will experience a soft landing, because the economy and job growth are strong. That appears to be the logic of certain pundits, and California's Inland Empire is an example of this New Millennium economy.
From local economist John Husing last month:
There's just too strong an economy and too much job growth for much other than the "soft landing" Husing and other economists have been predicting for the end of the five-year housing boom.And it's going to get even better as the Inland Empire Braces for Retail Boom:
"We are right on the cusp of a very powerful period in job growth," Husing said. "Local [Inland Empire, San Bernardino/Riverside area] unemployment in May was 4.2 percent, and that's the lowest I have seen for May in 42 years of studying the local economy.
...
"Is the housing market vulnerable?'' he asked. "Yes, it is. But is a bubble likely to happen? No, it is not. The underlying strength of our economy is too great.''
... inhabitants of the Inland Empire should hunker down for an unprecedented retail boom. ... that was the consensus at a panel ... at the first annual RealShare Inland Empire Conference, held [August 9, 2006].That is the optimistic view and many pundits have made the same argument for the entire U.S. economy too. On the other hand, is it possible that the Inland Empire economic boom has been driven by housing, and that the housing bust will start a downward vicious cycle?
First, here is some housing data released today by DataQuick: Southland home sales slowest in nine years; price gains lower.
Southland home sales downshifted last month to the slowest pace in nine years as the rate of appreciation fell to the lowest level since fall 1999, a real estate information service reported.Perhaps the Inland Empire immune to the housing slowdown. The following graphs are based on the DataQuick data. This is a comparison between Los Angeles and the Inland Empire (Riverside and San Bernardino) for the number of housing transactions and median house price.
...
Last month's sales total marked the lowest for a July since 1997, when 22,302 homes sold, and fell below the July average of 24,669 going back to 1988.

The first graph shows the monthly median home prices for Los Angeles, San Bernardino and Riverside since 2002.
Prices in the Inland Empire increased about the same as Los Angeles, and recently appear to have flattened out. Prices in both Riverside and San Bernardino are about 2% below their recent peaks.
 The second graph shows the year-on-year change in the median price for the three markets. YoY price appreciation is falling for all three markets.
 The third graph shows the YoY change in the number of transactions for each market.
There doesn't appear to be anything special about the Inland Empire when comparing the housing market to Los Angeles.
But when we look at employment, the Inland Empire stands out. For the U.S. economy, housing has been one of the main drivers of employment for the last few years. But no local economy has benefited more from the housing boom than the Inland Empire:
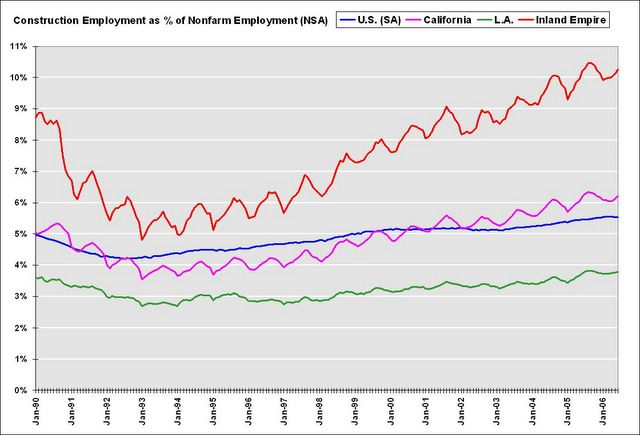
This graph compares construction employment, as a percent of total nonfarm employment, for the U.S., California, Los Angeles and the Inland Empire. Note: Construction includes non-residential construction.
Here is the hierarchy: Los Angeles has benefited less, in terms of employment, than most of California and the U.S. from the housing boom, California has benefited from the housing boom more than most of the U.S., and the Inland Empire is perhaps the greatest beneficiary.

So what happens during a housing bust? Just look at the unemployment rate in the previous bust.
The unemployment rate in California rose from 5.2% to 10.4% in just over two years. For the Inland Empire, the unemployment rate rose from 4.8% to double digits in the same period, peaking at 12.4%. Yes, California was impacted by Defense cutbacks in the early '90s, but the areas that were most dependent on housing saw the largest increases in the unemployment rate.
As the housing bubble unwinds, housing related employment will fall; and fall dramatically in areas like the Inland Empire. The more an area is dependent on housing, the larger the negative impact on the local economy will be.
So I think some pundits have it backwards: Instead of a strong local economy keeping housing afloat, I think the bursting housing bubble will significantly impact housing dependent local economies.
NAHB: Builder Confidence Slides In August
by Calculated Risk on 8/15/2006 01:14:00 PM
The National Association of Home Builders reports: Builder Confidence Slides In August Click on graph for larger image.
The HMI declined seven points to 32, its lowest level since February of 1991. This was the seventh consecutive month in which builder confidence, as measured by the index, has fallen.
"Two big factors are coloring builders’ perceptions of the market right now – rising sales cancellations and substantial growth in inventories of both new and existing homes," said NAHB Chief Economist David Seiders. "These factors are largely the result of an increasing number of potential buyers adopting a ‘wait-and-see’ attitude because of uncertainty about where the housing market is headed, and record-high energy costs also appear to be weighing on housing demand. We’re also seeing an anticipated withdrawal of investors/speculators from the market, following a major influx in 2004-2005."
...
All three component indexes declined in August. The component gauging current single-family home sales fell seven points to 36, while the component gauging sales expectations in the next six months and the component gauging traffic of prospective buyers both fell six points, to 40 and 21, respectively.
Regionally, the HMI recorded a three-point decline to 34 in the Northeast, a five-point decline to 15 in the Midwest, a nine-point decline to 41 in the South and a 10-point decline to 42 in the West.
The Housing bust is widespread and getting worse.
UPDATE: For numerologists: In July 1990, the NAHB Index dropped to 32 (the current level) and that was the start of the early '90s recession. The HMI has never before been at or below 32 outside of a recession.
Thornberg: Hard Landing Coming
by Calculated Risk on 8/15/2006 02:48:00 AM
The LA Times reports: Real Estate Economist Leaves UCLA Forecast
Bearish real estate economist Christopher Thornberg, who says the Southern California housing market is a bubble beginning to pop, has left UCLA Anderson Forecast to strike out on his own.Many of us have noticed that the Anderson Forecast has become less bearish on housing. I've suspected for some time that Thornberg disagreed with the consensus Anderson Forecast view that prices would be "flat" for several years.
Thornberg, 38, will continue to teach economics at UCLA but will no longer be part of the quarterly Anderson Forecast on the economies of California and the nation.
"I wanted to start my own business and do things I wasn't able to do before," said Thornberg.
His new consulting firm, Los Angeles-based Beacon Economics, will prepare forecasts for regions he thinks are underserved, perhaps including San Diego, the Inland Empire, the Bay Area and Sacramento, Thornberg said. His partner at Beacon is San Francisco economist Jon D. Haveman of the Public Policy Institute of California.
Now Thornberg can speak freely:
Thornberg said his expectations are growing more gloomy.
"My guess is we're going to have a hard landing," he said. "It's ugly out there."
There has been large-scale overbuilding of homes and condominiums nationwide, he said. "And here in Southern California we have had this massive price appreciation that is just not justifiable by any kind of standards of reasonable economics," he said.
Although home prices in most Southern California markets are still higher than they were a year ago, "there has been no appreciation for four or five months," Thornberg said.
With interest rates rising in recent months and sales declining, "the bubble is popping, just like a bubble is supposed to," he said.
In a soft landing, prices would level out and economic growth would be flat or slow while adjusting to the loss of jobs and spending in the construction, real estate and mortgage industries.
A hard landing could come if housing prices begin to fall, Thornberg said, in large part because that would scare consumers accustomed to watching their net worth rise on paper. Their spending pullback and a corresponding drop in construction could push the economy into recession.
Monday, August 14, 2006
Economic Predictions and Partisan Bias
by Calculated Risk on 8/14/2006 03:56:00 PM
Reading EconLog, I noticed Professor Kling's comment on Roubini's recession predictions:
Apparently, the echo chamber of left-wing macro pundits has pronounced a recession to be imminent. For example, Nouriel Roubini writes,This is a good point; we have to be careful about our biases."Given the recent flow of dismal economic indicators, I now believe that the odds of a U.S. recession by year end have increased from 50% to 70%."For these pundits, the most dismal indicator is that we have a Republican Administration. They have been gloomy for six years now.
From a stock market perspective, the current period reminds me somewhat of '94, especially market sentiment. Check out this Citigroup poll from MarketWatch: Citigroup poll shows wealthy worrying
"Investors' outlook for the nation's investment climate has fallen to an all-time low. Only one-quarter say the climate is better now than it was a year ago, down more than 20% from the start of the year," the report's authors said.Sentiment is at an "all-time low" for this poll. Note: For a laugh, check out their definition of "wealthy"!
Among those polled, 58% believe that the economy is in a slowdown, 12% say we're in a recession and 7% see the economy as going through an expansion.
Almost half of investors polled say the investment climate is worse than a year ago.
Back in '94, I remember it was very lonely being bullish. I still get congratulations for my VERY BULLISH call in Dec '94. I'm sure the market bulls are feeling pretty lonely now too.
There are several similarities between the current situation and late '94: the Fed stopped raising rates in Feb '95 and the Fed has probably just stopped raising rates in this cycle (although that isn't completely certain).
In '94 investors were saying the Fed rarely accomplishes a soft landing. We are hearing those same comments now.
Much of the bearishness in '94 was ideological. There were some prominent conservatives (one has a show on CNBC) who thought we would have a severe recession or even depression based on Clinton's fiscal policies. As Kling notes, much of the bearishness now is ideological. Many pundits think Bush is clearly the worst President in history and that colors their views.
I need to be careful and recognize my potential bias: I am strongly in the "Bush is the worst" camp, not because Bush is a Republican (as Kling suggests is the source of the bias), but because I believe Bush is incompetent and mendacious.
Even the earnings picture is similar.
S&P 500 earnings grew 50% over the two year period from '92 through '94, taking the PE down to around 14.5 in December '94. In the current expansion, S&P 500 earnings have grown substantial for four straight years (almost 40% over the last two years from '03 through '05). This has taken the PE down to about 16.4 at the end of last year, and based on current earning projections, the PE will be under 15 for the first time since '94.
Interest rates were higher in '94 than now, so all else being equal, a similar PE is even better today. So I could make a bullish argument based on earnings.
HOWEVER, there are significant differences between '94 and the present. Here are a just a few. First, housing. In '94, residential investment was recovering from the housing bust of the early '90s. Now residential investment has peaked and will almost certainly fall over the next few years.
Second is earnings diffusion: the oil companies are making a disproportionate share of earnings. In '94 earnings were more evenly distributed.
Third is imbalances: the General Fund deficit was falling in '94, currently it is rising (although we might see a small temporary decline this year). The trade deficit was 1.4% of GDP in '94, currently it is around 5.8% of GDP.
Fourth, the US consumer was in much better shape in '94. The savings rate in '94 was 4.8% and the Financial Obligations Ratio (FOR) was 14.5%. Now the savings rate is negative and FOR is 17.5%.
Also energy consumption, as a percent of GDP, was much lower in '94 and geopolitical risks were lower and improving. I may be biased, but I think geopolitical risks are high and rising today.
And finally, in '94 I thought the U.S. would avoid recession and the economy would grow nicely (call it a good guess that was partially based on my views on technology). Currently I think the odds of a recession are high.
Although I am biased, I think it's fair to say the economy has many more risks today than in '94. Still, if there is a soft landing, the markets will probably do reasonably well. If there is a hard landing (recession), look out below.
It's your call ...
Fannie Mae: Almost All Q2 Refis Involved Equity Extraction
by Calculated Risk on 8/14/2006 10:53:00 AM
From Berson's Weekly Commentary: Almost all refinances in the second quarter of 2006 involved equity extraction.
While refinancing activity has been slipping (we estimate that the refinance share of single-family mortgage originations fell to 36 percent in the second quarter from 52 percent in the first quarter), the share is still strong given the generally rising interest rate environment. So if borrowers aren't refinancing to reduce mortgage payments, why are they refinancing? Most are refinancing to take equity out of their homes (a so-called “cash-out refinance”) and an increasing share are refinancing out of adjustable-rate mortgages into fixed-rate mortgages...

The share of refinances involving equity extraction increased to 90 percent in the second quarter of 2006 -- the highest cash-out share recorded since we started keeping track in 1992 (see [graph]). We expect the cash-out share of refinances to increase when refinance activity is sluggish as the incentive to refinance to obtain a lower rate is diminished. We should also not be surprised to see a high cash-out share in a period of unprecedented house price appreciation.This corroborates the data from Freddie Mac and the BEA; homeowners were still using the Home ATM in Q2.
Friday, August 11, 2006
More on SoCal Housing
by Calculated Risk on 8/11/2006 11:15:00 PM
The following graphs are based on pricing and transaction data from DataQuick. Click on graph for larger image.
The first graph shows the monthly median home prices for Los Angeles, San Diego and Orange County since 2002.
Prices in San Diego started lagging the other markets in 2005 - prices peaked in November 2005, and prices are now falling. For San Diego, the July 2006 median home price is 6% below the peak of last November.
Median prices for both Los Angeles and Orange County are currently at, or just below, their respective peaks. The second graph shows the year-on-year change in the median price for the three markets. YoY price appreciation is falling for all three markets.
There was one last surge in 2005 for LA and OC. The third graph shows the YoY change in the number of transactions. For LA and OC, there was a final surge in activity that corresponds to the price action (previous graph).
For San Diego, YoY activity has been falling for 25 consecutive months.
My guess is San Diego is a few months ahead of LA and OC in the current down cycle, and that LA and OC prices will peak in the next few months - if they haven't already peaked.
NOTE: I compared the DataQuick numbers to the OFHEO House Price Index for the three markets (Los Angeles-Long Beach-Glendale, San Diego-Carlsbad-San Marcos, Santa Ana-Anaheim-Irvine). The appreciation since 2002 is very close using both data sets. When the OFHEO data series for Q2 is released in September, I expect San Diego's YoY appreciation to be close to zero and the quarterly prices to decline about 3%.
SoCal Housing Sales
by Calculated Risk on 8/11/2006 04:07:00 PM
From the San Diego Union: County home prices drop for second straight month
San Diego County's home prices dropped for the second straight month in July and the dominant single-family resale market was flat for the first time in a decade, DataQuick Information Systems reported today.And from the LA Times: Rise in L.A. Home Prices Slowest in 6 Years
The overall median price stood at $487,000, down 1.8 percent from July 2005. That was a decline greater than the 1 percent drop recorded on a year-over-year basis in June.
Local home prices have not been this low since they stood at $484,000 in April last year.
...
It was in sales activity that today's changing real estate market showed up most starkly.
The overall sales count of 3,370 homes sold in the county in July was down 21.6 percent from June and 29.3 percent from July 2005. It was the slowest July since 1996, near the end of San Diego's last major real estate recession, when there were 3,096 sales. July was also the 25th straight month to see a year-over-year sales decline.
July sales often trail those of June, but this year the month-over-month drop was the biggest since DataQuick began keeping records in 1988.
Los Angeles County home prices in July rose at their slowest pace in six years while values in San Diego County continued to fall, more evidence that the Southland's real estate market continues to slump, data released today show.And from the OC Register: Home-sales slump approaches '91 depths
Sales in Los Angeles County plunged 25%, the eighth consecutive month of declines, according to La Jolla-based research firm DataQuick Information Systems.
The median price of all Los Angeles houses and condominiums that closed escrow in July reached a record $520,000, up 6.6% from a year ago but virtually flat when compared to June's median of $517,000.
When the housing stats for all of July come out next week , the numbers will be ugly. With roughly a week of data still to be tabulated, DataQuick finds O.C. house sales running 35.3% below year-ago levels. Last time a bigger slump hit? In March 1991!It sounds like July was terrible for the housing market in SoCal.


