 RSS Feed
 by Calculated Risk on 5/25/2005 09:53:00 PM
Wednesday, May 25, 2005
FED: "Some buyers, some builders, some lenders are going to get burned"
Atlanta Federal Reserve Bank President Jack Guynn hinted at more rate hikes in his speech today. In the Q&A he commented on housing:
"There are some local markets, especially in coastal Florida, where I've heard stories for more than a year about behavior that's got to be characterized as nothing other than speculation," Guynn said it response to questions after his speech.On rates, Guynn said:
"It makes me very uncomfortable," he added. "Some buyers, some builders, some lenders are going to get burned, could very likely get burned, in some of those local markets."
"Given the current outlook for the economy, my personal view is that we've not yet reached a neutral policy stance."UPDATE: Dr. Polley earlier posted the same excerpts with a link to Guynn's speech.
Social Security: Senate Democratic Policy Committee Hearing
by Calculated Risk on 5/25/2005 02:28:00 PM
On May 13, 2005 the Senate Democratic Policy Committee held a hearing on Social Security. "An Oversight Hearing on President Bush's Social Security Privatization Plan: Will You and Your Family Be Worse Off?"
There were statements from Senators and five witnesses:
Robert Shiller
Professor of Economics at Yale University
J. Bradford DeLong
Professor of Economics at the University of California-Berkeley
Derrick Max
Executive Director of the Alliance for Worker Retirement Security and the Coalition for the Modernization and Protection of America's Social Security
Peter Orszag
Senior Fellow in Economic Studies and Director of the Retirement Security Project at the Brookings Institution
Beth Kobliner
Personal Finance Columnist and Author of Get a Financial Life: Personal Finance in Your Twenties and Thirties
Many of us have read Dr. DeLong's testimony on his blog. Here is an excerpt from Dr. Shiller's testimony:
I conducted a study in March 2005 that simulates the long-term performance of personal accounts, and the paper, data and simulation program are available on my book website irrationalexuberance.com. The paper uses historical returns from 1871-2004 to assess the likely outcomes of the President’s proposal for various worker choices among the options. It does 91 different simulations for a worker born in 1990 assuming that he or she experiences the actual returns from 1871-1914, 1872-1915, 1873-1916, all the way through 1961-2004.
This sample has a U.S. historical average real stock market return of 6.8% annually, slightly above the 6.5% annual return assumed by the Social Security actuaries. My study also included “adjusted” stock market returns designed to match the median stock return in 15 countries from 1900-2000, 2.2 percentage points lower than the U.S. returns over the same time period. I believe that the international return figure is more realistic.
I found that using U.S. historical returns, a benchmark life-cycle portfolio loses money 32% of the time (i.e., 32% of the time the internal rate of return is less than the 3% real return required to break even in the proposal). The median rate of return is 3.4% annually. Using more realistic adjusted returns, the benchmark life-cycle portfolio loses money 71% of the time and has a median rate of return of 2.6%.
The conclusion is that the president’s personal accounts, even the life-cycle portfolio, would subject Americans to serious risks. The Ownership Society is a long-term and elusive goal, and we should not expose people to unnecessary risks in an overambitious attempt to attain that goal.
For those following the housing market, yes, the same Dr. Shiller.
Tuesday, May 24, 2005
April New Home Sales: 1.316 Million
by Calculated Risk on 5/24/2005 06:38:00 PM
According to a Census Bureau report, New Home Sales set a record in April to a seasonally adjusted annual rate of 1.316 million vs. market expectations of 1.35 million. March sales were revised down significantly to 1.313 Million.
Click on Graph for larger image.
NOTE: The graph starts at 700 thousand units per month to better show monthly variation.
Sales of new one-family houses in April 2005 were at a seasonally adjusted annual rate of 1,316,000, according to estimates released jointly today by the U.S. Census Bureau and the Department of Housing and Urban Development. This is 0.2 percent above the revised March rate of 1,313,000 and is 13.3 percent above the revised April 2004 estimate of 1,162,000.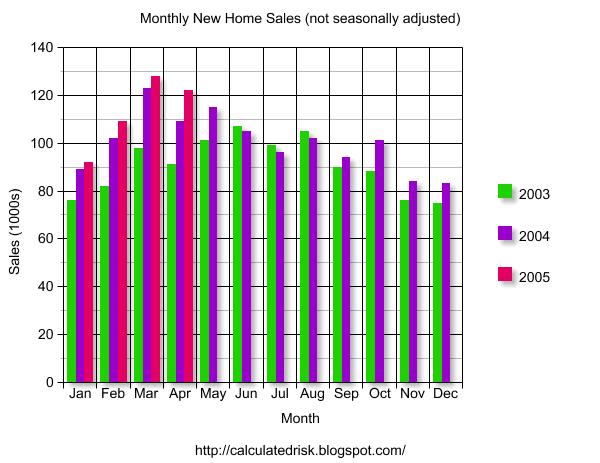
The Not Seasonally Adjusted monthly rate was 122,000 New Homes sold, down from a revised 128,000 in March.
The median sales price of new houses sold in April 2005 was $230,800; the average sales price was $283,500.
Both the median and average are in line with previous months.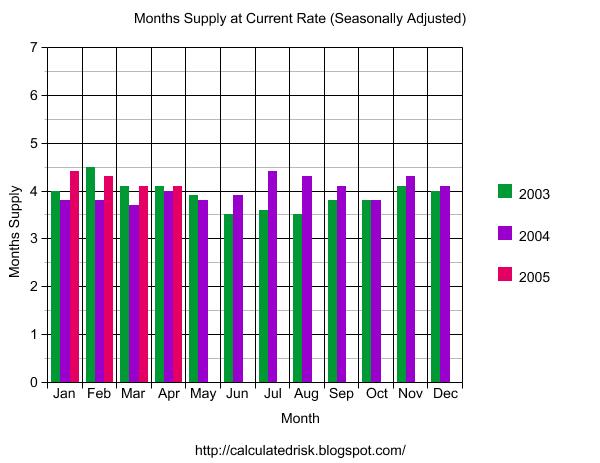
The seasonally adjusted estimate of new houses for sale at the end of April was 440,000. This represents a supply of 4.1 months at the current sales rate.
The seasonally adjusted supply of New Homes was 4.1 months, about normal for the last few years. The supply for March was also 4.1 months, revised from just 3.0 months.
The surprise was the significant downward revision in the March numbers.
Realtors' Economist: A Bubble
by Calculated Risk on 5/24/2005 03:28:00 PM
The head cheerleader for the housing market acknowledged the housing bubble today.
"Fifteen percent price appreciation is too much, even for me," David Lereah, chief economist at the National Association of Realtors, told CNBC's "Morning Call." "The real estate market is taking on a life of its own right now and we need to get a handle on it."Also, Equity loans alarm experts:
"If we return to prudent lending standards, that'll be the death of this housing market," says Keith Gumbinger of loan analysts HSH of Pompton Plains, N.J.I have nothing to add to those two statements!
Forecasting the Trade Deficit: Part II
by Calculated Risk on 5/24/2005 12:27:00 AM
The April trade balance will be reported on June 10th. I'm trying to develop a simple model to help predict the trade deficit. Last Thursday, I posted an oil import model (I need to add exports and Seasonal Adjustments). This post will address China. I'll post my methodology and hopefully others will offer suggestions and improvements.
My general approach is to divide the deficit into two components: petroleum energy related products and everything else. This is a mixed model, by "goods" for petroleum, by country or region for everything else.
CHINA
My approach to China is to assume trade follows the normal seasonal pattern and recent growth trends. The seasonal number will be adjusted according to container traffic at the Port of Long Beach. If anything unusual has happened (change in exchange rate, labor strike, new tariffs, etc.) I will try to factor that into the estimate. For April, the only "unusual" event was the soft patch in the US economy. This probably did not impact imports, so I will assume nothing unusual for April.
US IMPORTS
First, here are the monthly imports from China for the last 6 years.
Click on graph for larger image.
Imports from China have increased every year, except in 2001 when imports were relatively flat (during the US recession). A couple of features stand out: There is a consistent seasonal pattern to imports; low early in the year, building towards the Holiday season and then dropping off at the end of the year. 
The low for the year is usually in February, but it occasionally occurs in March like this year.
The second graph shows the last three years plotted against the best fit trend line. This clearly shows the seasonal pattern to imports.
Comment on Seasonal Adjustment: The seasonal adjustment is intended to remove the seasonal fluctuations from the data. This type of data is usually adjusted with a multiplicative approach: A = C x S x I where:
A = Observed Series (Not Seasonally Adjusted or NSA)
C = Trend Cycle
S = Seasonal Component
I = Irregular Component (weather, strikes, etc.)
Looking at the above graph, if the actual line is typical below the trend line for a given month, the observed numbers are adjusted upwards and if the line is usually above the trend, the oberved number is adjusted down. For April, the typical pattern shows about 4% below the trend line, so the observed number (NSA) will be adjusted upwards (SA). Errors occur if the trend changes. Also, the steeper the trend line, the more error prone the adjustment.
After reviewing the data, it appears that imports from China track inbound container shipments at the port of Long Beach. Of course this is comparing dollars to volume, so the mix of products has to remain relatively stable. The Port of Los Angeles also tracks imports relatively well, but there was a labor shortage last year and LB fit the data better.
This brings me to the first prediction for April: The trend for NSA imports for China is $17.8 Billion. Inbound container traffic was up 29% at both LB and LA ports (more than the usual March increase), so I'm going to adjust NSA upwards to $18.5 Billion.
US EXPORTS
The next step is to estimate the US exports to China. I'm going to use the same approach as for imports.
Exports to China do not show any seasonal pattern. There has been a steady increase with a slight jump in exports in 2003.
Since there is no seasonal pattern, the initial estimate is based on the trend line and the Port of Long Beach data. LB reported a 3% increase in loaded outbound containers, so the estimate will be the 3% higher than March or $3.4 Billion for April.
The final graph shows the relationship between containers and exports from LB. The bad news is the correlation is not as strong as for imports from China.
The good news is exports to China are relatively small compared to imports from China, so any error will have a minimal impact on the overall estimate.
The final step is to convert the NSA numbers to SA. Since there is little or no seasonal trend to US exports, $3.4 Billion is also the SA export number. For imports, the $18.5 Billion number is adjusted up by to $19.3 Billion.
The following table presents the actual for February and March (with estimate of the SA numbers) and the estimates for April.
CHINA TRADE BALANCE: Table numbers in Billions $
NOT SEASONALLY ADJUSTED
| MONTH | NSA Balance | NSA Exports | NSA Imports |
| February | -$13.9 | $3.08 | $16.95 |
| March | -$12.9 | $3.3 | $16.21 |
| April | -$15.1(est) | $3.4(est) | $18.5(est) |
SEASONALLY ADJUSTED (all estimates)
| MONTH | SA Balance | SA Exports | SA Imports |
| February | -$18.1 | $3.08 | $21.19 |
| March | -$15.1 | $3.3 | $18.42 |
| April | -$15.9(est) | $3.4(est) | $19.3(est) |
Note that February (usually a weak month for imports) was relatively strong and the SA number was probably over $21 Billion for imports from China, contributing to the record reported SA trade deficit.
Monday, May 23, 2005
Krugman, Housing, etc.
by Calculated Risk on 5/23/2005 12:51:00 AM
My most recent post is up on Angry Bear: Housing Update.
UPDATE: Mark Szlazak sent me a link (audio) to an interesting housing debate. Fast forward about 10 minutes. Very interesting comments.
UPDATE2: Click on graph for larger image.
Courtesy of WSJ.
The WSJ has a front page article on housing. See The Big Picture for excerpts.
Also, see Dr. Duy's Fed Watch: The FED and the Housing Bubble.
In a recent speech in Bangkok, Dr. Paul Krugman expressed concern about the housing market and the US economy:
Prof Krugman cautioned that the adjustment to the present global financial imbalance could be a "messy" and "deeply troubled" one.Further, in Krugman's Op-Ed today expressed even more concern:
"The US current deficit, at close to 6% of gross domestic product, would be in a danger zone by any standard of a crisis. Most developing countries have no alarms ringing, but the US looks serious."
The US housing market, he said, was also showing signs of a bubble, marked by high prices and speculative demand.
"Macro indicators suggest that the market is speculative mania. Day trading cannot be sustainable. There is a real bubble mentality in the US housing market," Prof Krugman said, adding that prices of US housing were 250% of their real values.
A fall in the housing market and investment would spur a US recession and lead to capital outflows. "There would be a difficult contraction in the US economy. It
would be a very difficult contraction for monetary policy to deal with. I think there is 50% chance for a major break in the situation in the US next year."
"So where will change come from?Although Dr. Krugman is not predicting a depression, I hope he isn't as prescient as FDR in this 1924 letter.
Everyone loves historical analogies. Here's my thought: maybe 2004 was 1928. During the 1920's, the national government followed doctrinaire conservative policies, but reformist policies that presaged the New Deal were already bubbling up in the states, especially in New York.
In 1928 Al Smith, the governor of New York, was defeated in an ugly presidential campaign in which Protestant preachers warned their flocks that a vote for the Catholic Smith was a vote for the devil. But four years later F.D.R. took office, and the New Deal began.
Of course, the coming of the New Deal was hastened by a severe national depression. Strange to say, we may be working on that, too."
"I remarked to a number of friends that I did not think the nation would elect a Democrat again until the Republicans had led us into a serious period of depression and unemployment",FDR, Dec 9, 1924
Friday, May 20, 2005
West Coast Ports: April Traffic Surges
by Calculated Risk on 5/20/2005 04:35:00 PM
Import traffic surged in April for both the Port of Los Angeles and Port of Long Beach. Thanks to Dr. Setser's site for these links.
For Los Angeles, the number of loaded inbound containers for April was 329 thousand, up 29% from March. Outbound traffic was flat (down 0.3%).
For Long Beach, the number of loaded inbound containers for April was 271 thousand, also up 29% from March. Outbound traffic was up 3%.
And in a related story, the West Coast ports will expand their hours to accommodate the expected surge in imports later this year:
Clogged with cargo and bracing for the onslaught of holiday-season imports, the largest U.S. seaport complex will begin this summer to charge a fee on peak-hours trade to encourage port usage on nights and weekends.
Operators of the Southern California seaports of Los Angeles and Long Beach will collect an estimated $160 million per year in fees on cargo delivered or departing during daytime hours, to pay for additional capacity during off-peak times.
The program is the first of its kind in the United States and is being closely watched by other U.S. port operators, said Bruce Wargo, the general manager of PierPASS, the not-for-profit group set up by port operators to administer the program.
Los Angeles and Long Beach form the country's primary trading gateway with Asia and handle more than $200 billion of cargo each year. The ports' top trading partners are China, Japan, South Korea, Thailand and Taiwan.
Greenspan: Only Recent Home Buyers to Have Problems
by Calculated Risk on 5/20/2005 03:57:00 PM
"... only those who have purchased very recently, purchased just before prices actually literally go down, are going to have problems."
Fed Chairman Alan Greenspan, May 20, 2005
Chairman Greenspan gave a speech on energy today, but in the Q&A he answered some questions on the housing market. Here are a few excerpts from Bloomberg:
Some regions of the U.S. housing market are showing signs of unsustainable ``speculation'' and ``froth'' based on fast turnover of existing homes, Federal Reserve Chairman Alan Greenspan said. The price surge may ``simmer down'' as housing becomes less affordable, he said.
``It's pretty clear that it's an unsustainable underlying pattern,'' Greenspan said in response to a question after a speech on markets to the New York Economic Club. ``People are reaching to be able to pay the prices to be able to move into a home.''
``There are a few things that suggest, at a minimum, there's a little froth in this market,'' Greenspan said. While ``we don't perceive that there is a national bubble,'' he said that ``it's hard not to see that there are a lot of local bubbles.''
And from CNN:
Eventually, home prices will decline because the underlying pattern is unsustainable, Greenspan said.My emphasis added. Very comforting for recent homebuyers.
"Without calling the overall national issue a bubble, it's pretty clear that it's an unsustainable underlying pattern. What we see are a number of forces, which are, as far as I can judge, not infinitely projectable," he said.
But when home prices slow, only those who purchased homes just as the prices begin to drop will be impacted by the decline, Greenspan said.
"The number of occasions in which an average level of prices in the United States have actually gone down are very rare," he said.
"Even if there are declines in prices, the significant run-up to date has so increased equity in homes that only those who have purchased very recently, purchased just before prices actually literally go down, are going to have problems," he said.
Forecasting the Trade Deficit: Part I
by Calculated Risk on 5/20/2005 01:01:00 AM
UPDATE: Error correction (thanks to fatbear), I wrote millions instead of billions in several places.
The April trade balance will be reported on June 10th. Over the next couple of weeks, I'm going to try to develop a simple model to predict the trade deficit. I'll post my methodology and hopefully others will offer suggestions and improvements. Of course, it takes more than one month's data to make a trend and these predictions are just for fun.
My general approach will be to divide the deficit into two components: petroleum energy related products and everything else. This is a mixed model, by "goods" for petroleum, by country or region for everything else. We have to be careful: there can be overlap between a country approach and petroleum approach: Canada and Mexico are good examples.
Part I: Energy-Related Petroleum Products (ERPP).
Each month, on exhibit 17, the Census Bureau and the Bureau of Economic Analysis present the imports for ERPP. These numbers are not seasonally adjusted (NSA).
To forecast the Petroleum number we need:
1) Price per barrel of crude oil.
2) Quantity of crude oil imported.
3) Price per barrel of "Other" ERPP
4) Quantity of "Other" ERPP.
Total NSA ERPP ($) = P (crude) * Q (crude) + P (other) * Q (other).
CRUDE OIL
To estimate the Crude price and quantity, I'm going to use the reported numbers from the DOE. On sheet "2-TWIP Crude World & US Prices", the DOE provides the weekly contract price back to 1997. On sheet "5-TWIP Crude Imports" the DOE provides the average daily imports, not including SPR. NOTE: Sheet 2 is contract prices, even though it is labeled "spot" prices "United States Spot Price FOB Weighted by Estimated Import Volume (Dollars per Barrel)".
It appears that the contract lengths vary over time, but an 8 week volume weighted average, provides a close approximation of the price. Using this data since Jan '97, this approach usually (2/3 of the time) comes within +/-2% of the Census reported price, although there were two months were it missed by 5%. Still the correlation is very good. Here is the DOE data since Feb 1:
| Week | Contract Price ($/BBL) | BBL (1000s/day) |
| Feb 04, 2005 | 37.915 | 9914 |
| Feb 11, 2005 | 36.575 | 10434 |
| Feb 18, 2005 | 38.076 | 9643 |
| Feb 25, 2005 | 40.567 | 10065 |
| Mar 04, 2005 | 43.377 | 10099 |
| Mar 11, 2005 | 45.463 | 10041 |
| Mar 18, 2005 | 46.42 | 10270 |
| Mar 25, 2005 | 46.969 | 10568 |
| Apr 01, 2005 | 45.324 | 9890 |
| Apr 08, 2005 | 47.688 | 9863 |
| Apr 15, 2005 | 44.23 | 9718 |
| Apr 22, 2005 | 43.957 | 10863 |
| Apr 29, 2005 | 45.902 | 10259 |
NOTE: I didn't try to adjust the week end to match the month end.
Using this approach, the predicted average March price per BBL/crude would be $41.20. This is almost 2% more than the reported price of $41.14. Pretty close. For April, the predicted P(crude) is $45.70.
For the quantity of crude, I used a 4 week average of the DOE's average daily crude imports. Since '97, using this method has resulted in a fairly consistent prediction that is about 4% low per month (a systemic error). So I adjust this number accordingly (divide by .96). The March prediction of Q (crude) would be: 330,812 BBLs. The actual number was 325,979 or about 1.5% less.
For March, the estimate of NSA crude = 330,812 * $41.20/BBL = $13.63 Billion compared to the actual of $13.41 Billion.
For April, the NSA prediction for Crude is: 328,592 * $45.70 = $15.0 Billion.
OTHER ERPP
According to the Census Bureau, Other ERPP includes "the following SITC commodity groupings; crude oil, petroleum preparations, and liquefied propane and butane gas". Since I'm not sure how to build up a price from all these products, I compared the price for Other ERPP to the price for crude (the 8 week moving volume weighted average). Although the relationship varies, using the following is relatively close: P (Other) = P (crude) * 1.15 (or 15% more). Most months fall within a +/- 5% of this price estimate. It probably depends on the mix of products and I couldn't determine any seasonal pattern to the price.
For Q (Other) I plotted the quantity of "other" since Jan '97. There has been a slight steady increase with a seasonal pattern. The best estimate for Other ERRP Quantity is probably the same month for the previous year. Sometimes this lead to a substantial error (20%), and I welcome a better approach.
For March, estimated Q (Other) would have been 100,000. Actual was 94,281. The estimated NSA Other was $41.20 * 1.15 * 100,000 BBL = $4.7 Billion. Actual was $4.5 Billion. The good news is that the larger percentage errors for "Other" are not very important for the overall ERPP.
For April, the NSA Other estimate = $45.70 * 1.15 * 82,000 BBL = $4.3 Billion.
NSA vs. SA
I haven't worked up a Seasonally Adjusted (SA) number yet for April ERPP. However, here are the numbers for Feb and Mar (see Exhibit 9 for SA numbers). It is interesting that NSA for March was $3 Billion more (or 20% more) than February, but SA March was only $0.75 Billion more (4% more) than February.
NOTE: These are IMPORTS only of ERPP. The US also exports ERPP that will have to evaluated too to estimate the total number.
Table numbers in Billions $
| MONTH | NSA | Seasonally Adjusted |
| February | $14.947 | $18.163 |
| March | $17.955 | $18.913 |
| April | $19.300(est) | To Come |
Here is the NSA estimate for April imports:
TOTAL NSA ERPP APRIL IMPORTS = $15.0 Billion (Crude) + $4.3 Billion (Other) = $19.3 Billion
SA to come. Part II will be about China.
Thursday, May 19, 2005
Fortune: Real Estate Gold Rush
by Calculated Risk on 5/19/2005 05:16:00 PM
The May edition of Fortune has the following cover "Real Estate Gold Rush":
UPDATE: Better photo from The Big Picture. The lead article is "Real Estate Frenzy: Riding the Boom".
(a pay article, but the lead paragraphs are free).
Speculation is the key to recognizing any financial bubble. Although the housing market remains incredibly strong, speculation is reaching a fevered pace. Articles (and covers) like this frequently appear at or near the top.
Hat tip to my friend Mish for the cover!


