 RSS Feed
 by Calculated Risk on 4/16/2005 10:25:00 PM
Saturday, April 16, 2005
John Snow: Misinformed or Mendacious?
US Treasury Secretary John Snow made the following comments at the G7 meeting in Washington regarding the US budget deficit:
-Snow said the US is strongly committed to cutting its budget deficit.
The White House motto apparently is: "Promise Prudence, Deliver Squander". Actions speak louder than words, and there are no actions that indicate the Bush Administration is committed to cutting the budget deficit. After four years of progressively worse deficits, only a fool would take their word. And next year's budget promises more of the same (see Another Budget, Another Disaster).
-[John Snow] said the budget deficit is expected to be 3.5 pct of GDP this year which is 'still too large', but the Bush administration's plans mean that the deficit should be cut to well under 2 pct of GDP by 2009.
This statement is simply untrue. The budget deficit will be close to $650 Billion this year or about 5.5% of GDP. Mr. Snow is using the Enron style "unified budget" that includes the Social Security surplus to offset Bush's deficit. A close approximation to the General Fund deficit is the annual increase in the National Debt. Anyone can check the increase in the debt by checking the US Treasury site.
As of April 14, 2005 the National Debt is $7.79 Trillion. At the start of the current fiscal year (Sept 30, 2004) the National Debt was $7.38 Trillion. That is a 6 1/2 month deficit of $408 Billion (close to 6% of GDP) and there are still 5 1/2 months remaining in the fiscal year.
There are no public plans to cut the deficit to under 2% of GDP by 2009. If they have a secret plan, they should tell the American people. More likely the deficit will be over 7% of GDP in 2009.
-'Deficits matter, they are unwelcome, and must come down,' [John Snow] said.
Tell that to Vice President Dick Cheney who, according to former Treasury Secretary Paul O'Neill, said "Reagan proved deficits don't matter." Since the Bush Administration's actions mirror Cheney's alleged comments, why should we believe Mr. Snow?
Is John Snow mendacious or just misinformed? Either choice is troubling.
G7 Preview: Oil, Renminbi and more
by Calculated Risk on 4/16/2005 01:58:00 AM
With global imbalances becoming more serious, the G7 will meet in Washington this weekend. Unfortunately, once again the US seems out of step with the rest of the World.
While the US is calling for "immediate flexibility on renminbi", Japan is saying the G7 will not press China for flexibility.
And US Treasury Secretary John Snow is calling for reforms in Europe and Japan saying: "They [Europe and Japan] clearly need to grow faster. They need to get rid of impediments and obstacles to growth in those economies. They have to grow faster. That is absolutely certain and that will be my principle message to my G7 colleagues."
But Jeroen Kremers, the Dutch IMF director stated: “Global external imbalances are caused by the US and Asia, not by Europe. Involving Europe in the call for action to correct external imbalances confuses the issue and has provided an excuse for inaction in the US.”
Perhaps the only area of agreement is that oil prices are too high and that better transparency of oil stocks is needed. Of course the Europeans think the US encourages waste with low taxes on oil. And the US thinks European taxes are too high.
And finally, I believe any discussion of global imbalances needs to start with the burgeoning US fiscal deficit, so it is no surprise that Mr. Snow has rarely mentioned it. To say the least, I'm not sanguine.
Friday, April 15, 2005
Housing: New Records in California
by Calculated Risk on 4/15/2005 01:57:00 AM
Both Northern and Southern California are reporting record sales for March according to DataQuick. Highlights for Northern California, Record Prices, Near-Record Sales:
Home prices in the Bay Area rose to new highs in March as sales for that month were at their highest level in sixteen years.
Prices are going up at their fastest pace in four years.
The typical monthly mortgage payment that Bay Area buyers committed themselves to paying was $2,566 in March, an all-time high. A year ago it was $2,052.
Indicators of market distress are still largely absent.
And the highlights for Southern California, Records and Near-Records in SoCal:
home prices in Southern California hit a new peak last month
Sales were near record levels
The typical monthly mortgage payment that Southland buyers committed themselves to paying was $1,983 last month, up from $1,905 for the previous month, and up from $1,602 for March a year ago.
Indicators of market distress are still largely absent.
Everything looks great, and yet ...
Social Security: Krugman, Marshall and Tanner Debate Video
by Calculated Risk on 4/15/2005 12:18:00 AM
On March 15, Dr. Paul Krugman, Talking Points Josh Marshall and Cato's Michael Tanner debated Social Security at the New York Society for Ethical Culture. The video of the debate is now available.
VIDEO Parts One and Two.
UPDATE: pgl at Angry Bear has some interesting comments: Social Security: Tanner v. Krugman and Marshall
And since I mentioned Krugman, be sure to read his Friday Op-Ed: "The Medical Money Pit". This piece covers most of the same ground as Kash and AB over on Angry Bear. An excerpt:
The authors concluded that Americans spend far more on health care than their counterparts abroad - but they don't actually receive more care. The title of their article? "It's the Prices, Stupid."
Why is the price of U.S. health care so high? One answer is doctors' salaries: although average wages in France and the United States are similar, American doctors are paid much more than their French counterparts. Another answer is that America's health care system drives a poor bargain with the pharmaceutical industry.
Above all, a large part of America's health care spending goes into paperwork. A 2003 study in The New England Journal of Medicine estimated that administrative costs took 31 cents out of every dollar the United States spent on health care, compared with only 17 cents in Canada.
In my next column in this series, I'll explain why the most privatized health care system in the advanced world is also the most bloated and bureaucratic.
Thursday, April 14, 2005
IBM: More Evidence of a Global Slowdown
by Calculated Risk on 4/14/2005 07:25:00 PM
IBM reported that earnings would fall short of expectations: "IBM Misses Quarterly Earnings Forecast". Perhaps more important than the earnings announcement was this comments by IBM's Chairman and CEO Samuel J. Palmisano:
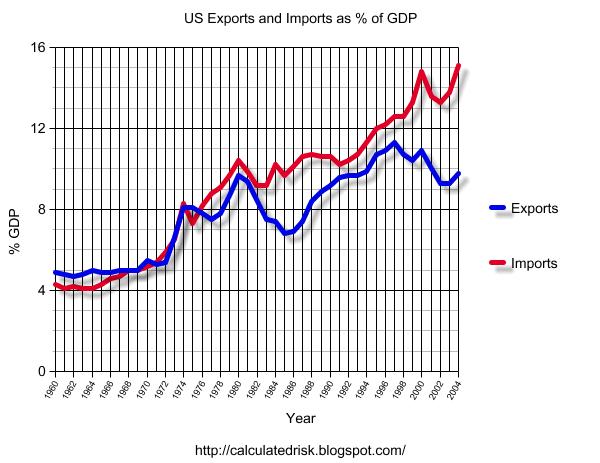
"After a strong start, we had difficulty closing transactions in the final weeks of the quarter, especially in countries with soft economic conditions, as well as with short-term Global Services signings,"This comment does not bode well for the US trade and current account deficits. The following graph shows the total US imports and exports since 1960.
Click on graph for larger image.
Imports have been rising fairly steadily since the early '70s. Exports have also been rising, but they have been more erratic. There have been two large declines in exports, the first in the early '80s and the other recently. Both declines were associated with a strong dollar as the next graphs indicate.
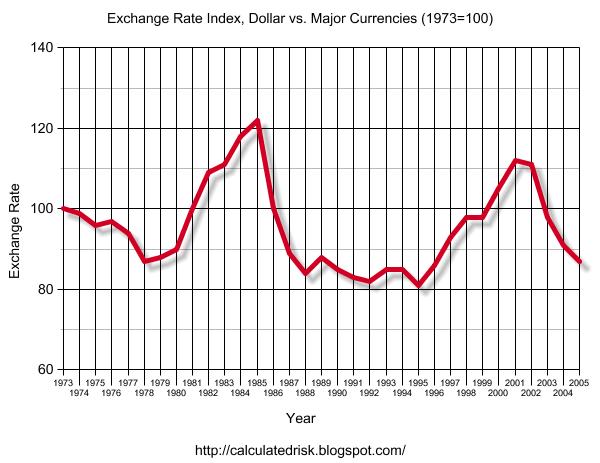
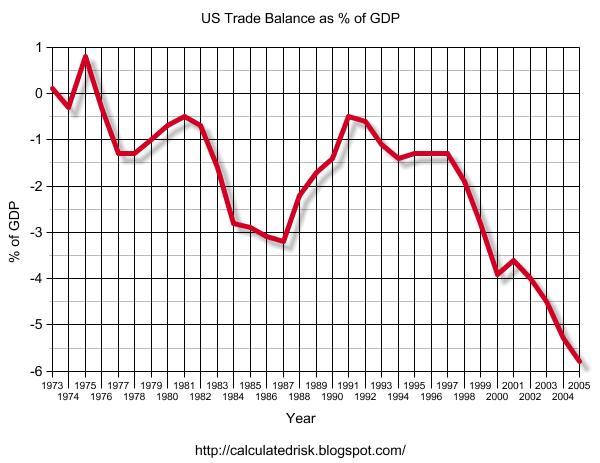
This graph shows the exchange rate since 1973 for the dollar against major currencies as calculated by the Federal Reserve. The second graph for the same time period shows the trade balance as a % of GDP.
NOTE: The 2005 trade deficit is estimated at $720 Billion with a 6% nominal increase in GDP.
The signing of the Plaza Accord in 1985 is very clear as the value of the dollar started to drop. The dollar stopped dropping in 1987 with the Louvre Accord. The weaker dollar clearly led to an increase in American exports.
With the recent dramatic drop in the value of the dollar, many people are hoping that the US exports will start to increase again in relation to imports. But with overseas economies faltering and the US economy still strong, US exports will probably continue to decline in relation to imports.
An improvement in the trade balance requires either overseas economies to strengthen or a slowdown / recession in the US.
New Inflation Tool at the Cleveland Fed
by Calculated Risk on 4/14/2005 12:32:00 PM
The Cleveland Fed has introduced "Inflation Central", a Worldwide database of inflation measures.
See World Inflation From The Cleveland Fed at Macroblog for much more.
I was surprised to discover that Bangladesh has had more inflation than Albania. But what do I do with that information?
Wednesday, April 13, 2005
More on Health Care
by Calculated Risk on 4/13/2005 06:39:00 PM
The highest priority fiscal problem in the US is the budget deficit; we will add close to $650 Billion in debt this fiscal year alone! The second highest priority is the US health care system.
In "Ailing Health Care", Paul Krugman tries to change the debate from Social Security to health care. As Krugman wrote, the issue is "health care reform," not "Medicare reform." The problem is far larger than Medicare alone, and yet the Medicare shortfall dwarfs the projected Social Security shortfall.
Earlier this year, the GAO pointed out that health care is the largest and perhaps most difficult part of the long-term fiscal challenges. The GAO calculated the Social Security shortfall at $3.7 Trillion (over 75 years) and the Medicare shortfall at almost $28 Trillion over the same period; more than 7 times larger than the Social Security shortfall. And Medicare is only a portion of the health care crisis!
As a follow up to Krugman, Kash compared some outcomes and expenses in the US to several other developed Nations.
Today, Kash followed up with more comments on the "Performance of the US Health Care System."
Angry Bear followed up with the first in a three part series: "Health Care in The U.S. And The World, Part I: How much do we spend?"
If it was up to me, I would change the debate to the deficit. But real budget solutions are probably unachievable in this ideologically driven period. Doesn't that apply to health care too? So what is the solution? Do nothing for four years?
Tuesday, April 12, 2005
The Mug's Game Challenge: Predict the Start of the Next Recession
by Calculated Risk on 4/12/2005 05:47:00 PM
A recession is probably not imminent, but there are reasons to be concerned. General Glut ventured this today:
The "hard versus soft" landing debate is stale. The real question now is only "how hard?"The next question is: When?
The Mug's Game Challenge
Here is a simple contest to predict the start of the next recession. The rules:
1) Enter a month and a year in the comments at any time right up to the recession being announced (one entry per person). Please feel free to state your reasons. I will feature those comments for the winners.
NOTE: You do not need to enter now. I am still waiting before I make my prediction. But early entries will be rewarded. I will update the contest every month as a reminder.
2) Scoring:
A) The Starting Month: The official starting month will be determined by the NBER. This usually occurs several months after the recession starts.
B) A pick will be considered correct if it is within +/- 2 months of the NBER determination (a 5 month window centered on the month picked). It is VERY difficult to pick the exact month, and being within a couple of months is quite an achievement.
C) All correct picks will be ranked by the number of months prior to the recession that the pick was entered. As an example, say the recession starts in Oct 2005: If someone correctly picks any month August 2005 through December 2005 (+/- 2 months) during April 2005, they will be rated a "6". This rewards picking the recession early.
All correct picks will be featured when the recession is announced and ranked by earliest picks.
Earlier I offered some thoughts on leading indicators for recessions. Several people have suggested other leading indicators to me. No one wants a recession, but we might as well have some fun!
Good luck to all!
UPDATE: Prize? The winners get their names mentioned, their comments featured, the admiration of their peers, and a free subscription to Calculated Risk!
UPDATE 2&3&4: Elaine is already a winner! Here are the picks so far (updates in bold):
Aug 2005 Kirk Spencer, wharf rat
Sep 2005 Vernon Bush
Oct 2005 BE, David Bennett
Nov 2005 David Yaseen, Fernando Margueirat, steve kyle, Nguyen Khuu
Jan 2006 Yusef Asabiyah, dryfly, Frank, redfish
Feb 2006 Mish, E.Robinson
Mar 2006 Colin H, ChasHeath, Alan Greenspend, Movie Guy, F.Hagan
Apr 2006 battlepanda
May 2006 Ken Houghton, navin
Jun 2006 DOR
Aug 2006 Jason Wright
Mar 2008 dilbert dogbert
Jul 2008 jl
Nov 2008 Elaine Supkis
March, 2011 Paul
NEVER Larry Kudlow's doppelganger
Posters can take the same month.
Record US Trade Deficit: $61 Billion for February
by Calculated Risk on 4/12/2005 08:49:00 AM
The U.S. Census Bureau and the U.S. Bureau of Economic Analysis released the monthly trade balance report today for February:
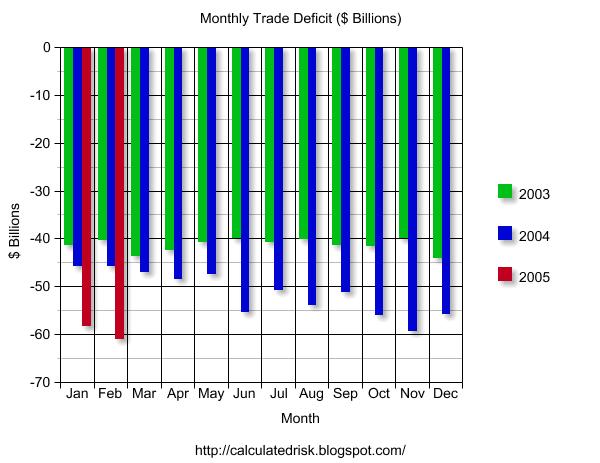
"... total February exports of $100.5 billion and imports of $161.5 billion resulted in a goods and services deficit of $61.0 billion, $2.5 billion more than the $58.5 billion in January, revised.
February exports were $0.1 billion more than January exports of $100.4 billion. February imports were $2.6 billion more than January imports of $158.9 billion."
Click on graph for larger image.
This graph shows the monthly trade balances for 2003, 2004 and 2005 and depicts the worsening year over year trade imbalance. The February trade deficit was an all time record, as exports stalled and imports continued to climb.
The recent increase in oil prices did not impact the February trade deficit. In fact, Oil imports were down slightly in February. The following graph shows the impact of imported oil on the trade deficit.
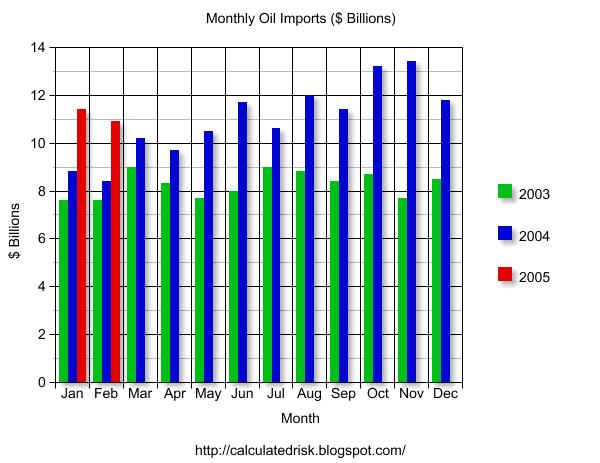
This graph shows oil imports per month for 2003, 2004 and the first two months of 2005. Oil imports are less than 20% of the trade deficit and just over 1% of GDP (as discussed in this post on Angry Bear). Even without oil, the trade deficit would be 5% of GDP - a serious problem.
The recent run up in oil prices will impact the trade deficit for March.
UPDATE: The average contract price for crude oil in Feb was $36.85 per barrel. According to the DOE, the average price will be almost $10 higher for March. That will add $4.5 Billion to the trade deficit, before seasonal adjustments - or another $3.5+ Billion to imports in March.
I expect the trade deficit for March to even be worse!
Monday, April 11, 2005
More on Oil
by Calculated Risk on 4/11/2005 04:50:00 AM
My most recent post on Angry Bear, Oil: The Impact on the US Economy, is now up.
On the following graph, I plotted total oil consumption and imported oil consumption as a % of GDP. The plot for imported oil is slightly different than from my previous post (if you have a microscope!).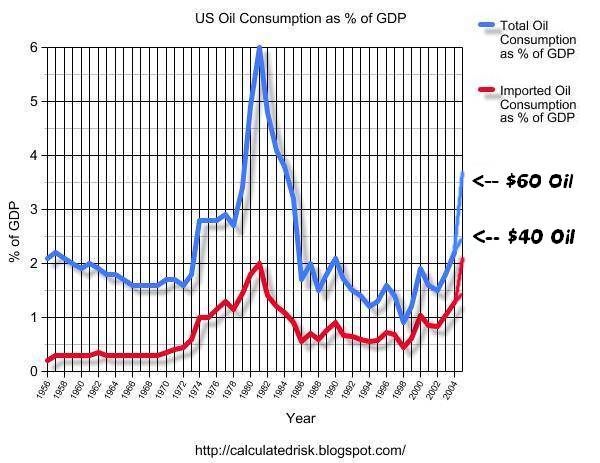
Click on graph for larger image.
The reason for the difference is I used different data sources. For this post, I used the DOE's data and for the previous post, I used the Census Bureau's trade data. They were very close, but I was able to plot a longer time series with the DOE's data.
I did not discuss peak oil in this analysis. That is a separate topic. I tried to stick to the question of the immediate impact on the US economy of the current price of oil.
Best Regards to All! And thanks for all the comments.


