 RSS Feed
 by Calculated Risk on 3/22/2005 09:24:00 PM
Tuesday, March 22, 2005
Forbes: Homeowners in Hock
This month's Forbes has an article about homeowners extracting equity from thier homes to "finance consumer expenditures". The article discusses several issues: the low savings rate, noting that "the personal savings rate has fallen from 6% of GDP 12 years ago to a mere 1% now", mortgage equity extraction (with a nice chart), and they hint at the link between equity extraction and the trade deficit.
If Forbes had taken the next step, they would have compared equity extraction to GDP growth (see: "Mortgage Debt and the Trade Deficit") and they would have asked what is the impact on trade and GDP if housing slows (see my musings "Housing and Trade: Virtuous Cycle about to Become Vicious?")
If housing slows that will end the equity extraction game. With rising interest rates and higher energy costs, a housing slow down is probably imminent and inevitable. Trying to determine the impact of an impending housing slow down on the general economy is the next puzzle.
Monday, March 21, 2005
Guest Bloggin' on Angry Bear
by Calculated Risk on 3/21/2005 01:24:00 AM
I've been invited to be a guest blogger on the Angry Bear. I will be posting on Mondays.
Here is my first (and hopefully not last) post: "Another Budget, Another Disaster".
A little introspection: What am I trying to accomplish with blogging? Initially I just wanted to understand what blogging was all about. Then I wanted to improve my writing skills (still working on that) and my understanding of economics (a hobby and a passion for me).
But most of all, I'm hopeful that the Internet and blogging will bring the America I love and believe in, back to the fore. Blogging is the 21st century pamphleteering and sometimes (offered in all humbleness) I sense the ghost of Thomas Paine.
Best Regards to all!
Saturday, March 19, 2005
Housing and Trade: Virtuous Cycle about to Become Vicious?
by Calculated Risk on 3/19/2005 09:33:00 PM
There appears to be a relationship between housing and the trade deficit as suggested by the 2nd graph in this earlier post. Perhaps we have seen a Virtuous Cycle as depicted in the following diagram: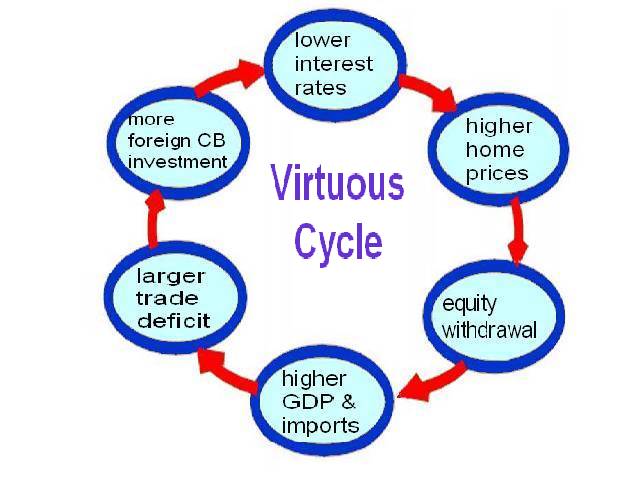 Click on diagram for larger image.
Starting from the top: There is no question that lower interest rates have led to an increase in housing prices. And those higher housing prices have led to an ever increasing equity withdrawal by homeowners.
A few numbers: Total mortgage debt increased $900 Billion in 2004 and $733 Billion in 2003; a significant increase from the $200 Billion in '97. In another measure called MEW "Mortgage Equity Withdrawal" (that is used in the UK), Goldman Sachs senior economist Jan Hatzius has calculated (reg. required) that homeowners have pulled $640 Billion from their homes in 2004, as compared to just $74 Billion ten years ago.
Since the savings rate has declined, it is reasonable to assume that a large percentage of this equity withdrawal has flowed to consumption, increasing both GDP and imports over the last few years. Since the annual increase in mortgage debt has exceeded GDP growth for four consecutive years (see graph 1), a large portion of this equity withdrawal has flowed to consumption of imports. Therefore it appears mortgage equity withdrawal has been a meaningful contributor to the ever widening trade and current account deficits.
To finance the current account deficit, foreign Central Banks (CBs) have been investing heavily in dollar denominated securities. Some analysts have suggested that these investments have lowered interest rates by between 40 bps and 200 bps (Roubini and Setser: "Will the Bretton Woods 2 Regime Unravel Soon? The Risk of a Hard Landing in 2005-2006")
If these analysts are correct, and foreign CB intervention is lowering treasury yields, then this has also lowerered mortgage interest rates ... and the cycle repeats. The result: a Virtuous Cycle with higher housing prices, more consumption and lower interest rates.
As a result of the rapidly increasing housing prices, we are now seeing significant speculation, excessive leverage and poor credit quality of new homebuyers; all the signs of an overheated market. As an example, in this article "Miami's Changing Skyline: Boom Or Bust?", a Raymond James and Associates representative is quoted as saying: "as much as 85 percent of all condominium sales in the downtown Miami market are accounted for by investors and speculators." What happens if the housing market cools down?
The Vicious Cycle
The following diagram depicts the possible unwinding of the current cycle.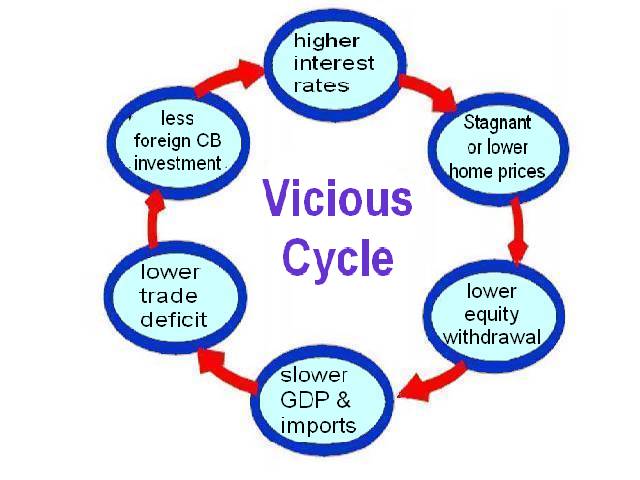
If housing cools down (prices do not need to collapse), this will lead to lower equity withdrawal. In turn this will lead to a slow down in GDP growth and lower imports.
Lower imports might lead to a lower trade deficit, depending on the strength of exports. This could lead to less foreign CB investment in dollar denominated assets. And this could lead to higher interest rates followed by lower housing prices and the cycle repeats.
The result: a Vicious Cycle with lower housing prices, less consumption and higher interest rates.
Thursday, March 17, 2005
Senator Reid: An Online Interview
by Calculated Risk on 3/17/2005 10:29:00 PM
Democratic Senator and Minority Leader Harry Reid (D-Nev) gave an interview to a blogger this week. The interview is worth reading and I would like to highlight a couple of points:
Sen. Reid on the budget:
... –this budget–everything is being put to the back burner except these tax cuts being made permanent. This document should be filed under fiction in the Library of Congress because they don’t include the costs of the ongoing war in Iraq, they don’t list there the tax cuts, what that cost is going to be over the years; it doesn’t take into consideration so many different things, Social Security costs, and for the first time in the history of the country, they’re doing a budget on a five year budget rather than a ten year because if you look past five years its even more bleak than the first five years.And on the media and the Internet:
Raw Story: I think it’s significant that you’re giving an interview to us as an online site. I’m curious as to what your opinions are on the role of blogs and where you see them in the political ecosystem.
Sen. Reid:
I personally believe that much of what goes on in America today is governed by wealth and power. That if you look at what’s happened with the newspapers over the years, during the days of the founding fathers, they used to post newspapers in public squares and people who couldn’t read had the papers read to them. The Federalist Papers were a way of communicating; people read and learned. Well, when the radio came along, it changed it a little bit, but you still had the Fairness Doctrine so you didn’t have to worry. Really, the beginning came in the early 1950s; I think it was ‘52 or ‘53 when the networks decided to go to half-hour news programs. Then people stopped reading the newspapers even more. But on television you had the Fairness Doctrine.My emphasis added.
What has happened in recent years, the Fairness Doctrine has been taken away, that is, equal time for pros and cons on an issue. And they also allowed the concentration of media power, so one station, one owner can own 1,200 radio stations. What this means is that wealth and power control most everything in this country. But one thing they do not control–wealth and power does not control the Internet. Through the Internet, regular ordinary people have a voice. That’s why I go out of my way to communicate any way that I can on the Internet and I think the blogs are a tremendously important way for the American public to find out what’s really going on.
I agree with Sen. Reid's comments on the budget and the media. Read the entire interview here.
Tuesday, March 15, 2005
California Real Estate Prices: Boom and Bust
by Calculated Risk on 3/15/2005 11:39:00 PM
Today I heard someone comment that California Real Estate never goes down. In fact, California RE has declined in the past in both real and nominal terms.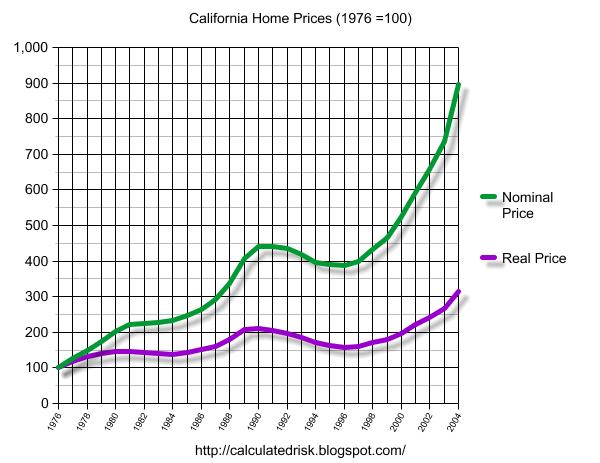
Click on graph for larger image.
This graph shows the price of California RE based on the OFHEO California housing index. For the real price, the nominal price is adjusted by CPI, less Shelter, from the BLS.
(1976 = 100)
The graph shows that in real terms we have seen two declines since 1980. The first decline, in the early '80s, lasted 3 years. The second decline, in the early to mid '90s, lasted 6 years.
The second graph shows the same information by annual rate of return, both real and nominal.
The decline in the '90s lasted 24 quarters from peak to trough. It took 9 years for prices to recover in nominal terms to their early '91 peak. Overall prices declined 12% in nominal terms and 26% in real terms.
Even more important for the economy are the coincident declines in sales volume. Real Estate prices are “sticky downward” since sellers are slow to adjust their prices down, and buyers are reluctant to buy a declining price asset. In this regards, real estate is an imperfect market in that prices adjust slowly to changes in supply and demand (unlike commodities like corn or wheat). Although prices do decline, it’s the decline in volume that leads to declining employment in real estate related occupations like construction, RE sales, mortgages, and more, and impacts the general economy.
UCLA Anderson Forecast: False Sense of Wealth
by Calculated Risk on 3/15/2005 09:46:00 AM
2nd UPDATE: Another good article with more quotes and facts from the Anderson Forecast:
From 2001 to 2004, the value of California's 7 million homes has increased by about $175,000 per home, resulting in a total rise of more than $1.2 trillion according to UCLA Anderson Forecast. Appreciation of apartments has added an additional $440 billion.And on the Central Valley:
"To put this in context, the personal income for the state was $4.7 trillion over the same period of time," the forecast states. "Hence, Californians have been essentially given a 30 percent-plus boost to their annual incomes due to the housing bubble we are currently experiencing."
The forecast is especially ominous for the central San Joaquin Valley, where the building boom has fueled some of the strongest job growth in the state. Of the 3,900 net new nonfarm jobs created in Fresno County last year, for instance, 2,100 were created in construction, an amount 3 1/2 times greater than that added in manufacturing, according to state jobs data.
UPDATE: A couple more quotes:
“This year we are expecting trouble with housing in the second half that will make GDP growth a little weaker than normal, but it (is) unlikely that a recession could get started that quickly without more telltale signs today,” [UCLA Anderson Forecast Director Edward] Leamer’s report said.ORIGINAL POST:
“The key here is that at best the state economy can be expected to maintain slow growth over the next few years as the weak housing sector saps off strength created in other parts of the state’s recovering external economy,” the report stated. “On the other hand, a sudden rise in interest rates or some other spark that could cause the housing sector bubble to implode at a faster rate could instead cause another recession, both in California and the U.S.”
This morning, at a UCLA conference, forecasters will caution on the impact of a Real Estate slowdown on California and the Nation. From an LA Times article:
Half of the private-sector jobs created in California in the last two years are connected in some way to real estate. Meanwhile, property values in the last four years have swelled $1.7 trillion, the equivalent of about 35% of the total personal income in the state since 2001.
This sharp increase in home equity has spurred consumer spending that, in turn, has fueled more economic growth.
"We have an economy that's rolling along on the basis of a false sense of wealth," said Christopher Thornberg, a senior economist with the Anderson Forecast team.
In a previous post, I discussed the impact of a housing slowdown on employment. The following graph shows the growth in employment in just one housing related area: mortgage employment.
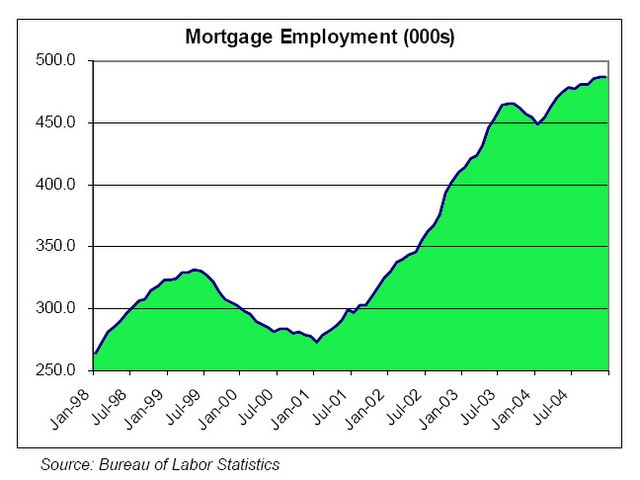
We see that we have added 200K jobs in the mortgage industry alone in under 4 years. The mean salary (according to the BLS in 2001) was $45,380 for the mortgage industry.
Click on graph for larger image.
Graph thanks to ild and Elroy.
Another example: Just 2 years ago, there were 338,579 licensed RE Agents (brokers and salespeople) in California. Now, according to the Department of Real Estate, there are 423,315 licensees.
More from the article:
Thornberg said that in California, where home prices have increased faster than in the rest of the nation, the situation is precarious. Even a simple slowdown in the accumulation of equity in the state, he said, could harshly depress spending habits, job creation and economic expansion.
Real estate has become central to California's economy. Real estate-related jobs account for about 10% of private sector jobs in the state, according to the Anderson Forecast, and are growing rapidly.
Of the 243,000 private payroll jobs added in California since 2003, 122,000 are linked to the industry — jobs with construction companies, mortgage processing centers and the like.
And Thornberg's final comment: "The best-case scenario is mediocre."
Monday, March 14, 2005
Mortgage Debt and the Trade Deficit
by Calculated Risk on 3/14/2005 09:02:00 PM
Money flowing into the housing market works its way back into the economy by increasing consumption or savings (and investment). In recent years, aggregate savings have declined, therefore it appears money has flowed to consumption, both domestic (measured by the increase in GDP) and imports (measured by the increase in the trade deficit).
This is very simplistic but provides a general description of what I believe is happening. I will use the annual increase in mortgage debt as a measure of the money flowing into the economy from housing activities.
Previously I posted a graph of the annual Increase in Mortgage Debt vs. the Increase in GDP. The graph illustrated that during each of the preceding four years, U.S. households had assumed more mortgage debt than the increase in nominal GDP. I was asked if there were any other periods of similar increases in mortgage debt. The answer is NO, at least not in the last 40 years, as shown by the following graph:
The last four years have been atypical. There has been a surge in mortgage borrowing that far exceeded nominal GDP growth. It is unclear how much of GDP growth was driven by the increase in mortgage debt. However, since I believe most of the mortgage debt has flowed to consumption (not savings or investment); the portion that didn’t contribute to GDP growth must have flowed to imports.
Click on graph for larger image.
From the following chart it appears that the increase in mortgage debt is a factor in the increased trade deficit. The chart shows the annual trade deficit compared to the annual increase in mortgage debt. Data sources: trade deficit, GDP, New Home Sales, Mortgage Debt.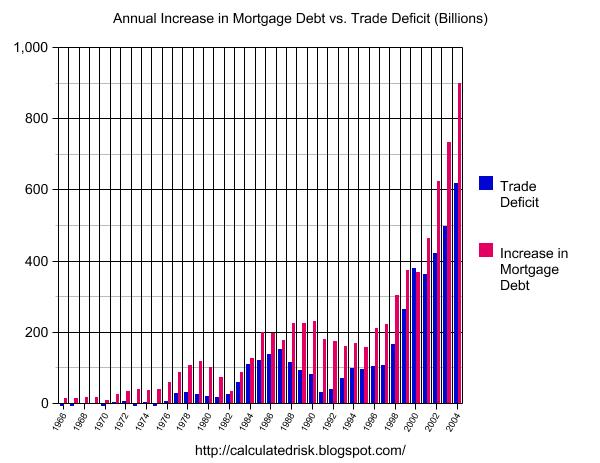 There is a strong correlation between increases in mortgage debt and increases in the trade deficit. Although the correlation is high, it is very possible that there is no direct linkage, instead the same economic causes that led to higher trade deficits also led to more household borrowing. However, in recent years, with the dramatic increases in mortgage borrowing (far exceeding the increases in GDP) it is reasonable to expect that some of that money is flowing to imports.
The implications are important: if the housing market slows down, it will negatively impact both the domestic economy and the economies of our export driven trading partners: China, Japan, S. Korea and others.
The concern is obvious: If we slide into a global recession, we have limited tools available to stimulate the economy. Interest rates are already very low (although the Fed has recently put some arrows back into the quiver), and we are already running general fund budget deficits of close to 6% of GDP. And the concerns are not just economic. Historically, poor economic conditions are the precursors to civil unrest and wars.
One thing is certain, mortgages and housing play a much larger role in today's economy than in the past. In another recent post, I had suggested that the volume of New Home Sales seemed like a reasonable leading indicator of the consumer economy. The following graph shows New Home Sales since 1963.
The gray lines are approximate U.S. economic recessions as determined by NBER. With the exceptions of the 2001 (non-consumer recession) and '69-'70 recessions, New Home Sales were falling for 8 to 12 months prior to the onset of the recession. Since housing is a significantly larger portion of the economy today, a slowdown in housing would have a corresponding larger impact on the overall economy.
That is why I’m so focused on the housing market. I would like to see an orderly rebalancing of the World's economy, but I am not sanguine.
Friday, March 11, 2005
China Reduces Dollars in Its Reserves, Lehman Says
by Calculated Risk on 3/11/2005 01:39:00 AM
According to a Bloomberg article based on a Lehman report, China has "cut the share of its currency reserves held in dollars and raised its holdings of euros".
Lehman also predicts China will allow the yuan to fluctuate by the end of June.
First, in late February, Korea was rumored to be diversifying "the currencies in which it invests".
Then, two days ago, Japanese Prime Minister Junichiro Koizumi said his country ``in general'' needs to consider diversifying its foreign currency reserves.
Now China.
Thursday, March 10, 2005
Mortgage Debt Increases 13% in 2004
by Calculated Risk on 3/10/2005 11:47:00 PM
Today the Federal Reserve released the "Flow of Funds Accounts" for 2004. The report shows that total household mortgage debt increased 13.5% in 2004. The following chart shows the annual rate of mortgage debt increase: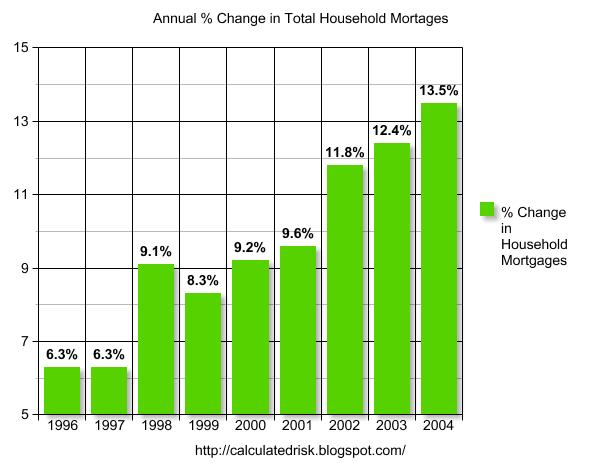
Click on graphs for larger image.
The rate of increase of mortgage debt has increased every year since 1999.
Household mortgage debt increased from $6.64 Trillion in 2003 to $7.54 Trillion in 2004.
The next graph shows the Fed's estimate of the market value of all household real estate and household mortgage debt as a % of GDP.
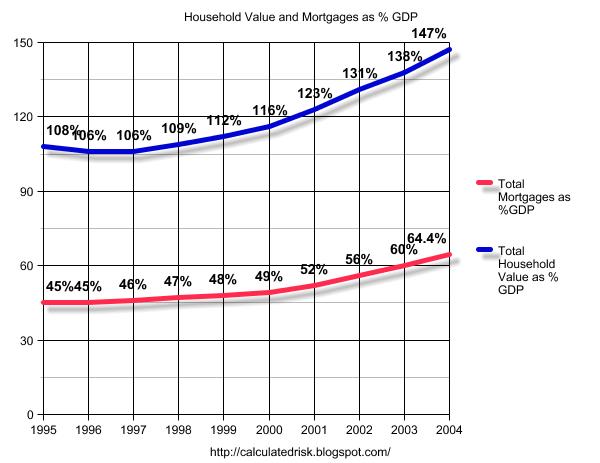
Although mortgage debt has shown a substantial increase as a % of GDP (almost 20% over the last decade), the estimated value of household Real Estate has also increased substantially.
The appreciating value of household RE has kept the debt to value ratio under 50% based on the Fed's estimates.
The final graph compares the annual increase in mortgage debt to the annual increase in GDP. This shows the impact of mortgage debt on GDP. 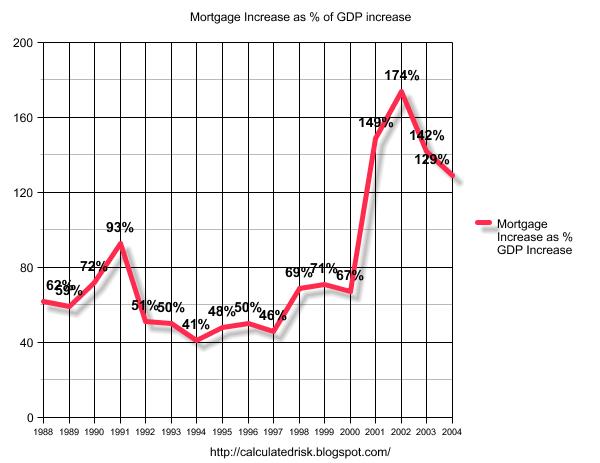
The economy was in recession for part of 2001, so it is not surprising that mortgage debt exceeded GDP growth for that year.
However, it is surprising that mortgage debt has substantially exceeded GDP growth for four consecutive years.
This lends credence to the idea that the American consumers are maintaining their lifestyles using their homes as ATMs. Please see these previous posts that expound on this supposition:
Mortgage Debt and the "Recovery"
A Recovery Built on a Marshland of Debt?
Volcker: Circumstances "dangerous and intractable"
The Other Trust Funds
by Calculated Risk on 3/10/2005 03:02:00 PM
With all of the attention on Social Security (OASI), perhaps we should also look at some of the other trust funds. As an example, the CSRS (Civil Service Retirement System) is similar to OASI program. CSRS is a defined benefit plan that uses contributions from today's employees to pay today's retirees. And like OASI, CSRS is running annual surpluses; $28 Billion in fiscal 2003. SOURCE: Monthly Treasury Statement.
But unlike OASI, CSRS is on-budget and is included in the President's budget report. In fact, with the exception of OASI and the Postal Service, all of the other trust funds (150+ in all) are included on-budget. This means that the surpluses from these programs are used to directly offset any deficit spending by the Federal Government. Of course, even Fed Chairman Greenspan talks about the "unified" budget that includes the OASI surplus as part of the budget - so the distinction between on-budget and off-budget is being lost.
This graph shows the growth of both OASI and the other trust funds. SOURCE: Treasury Dept.
Trust Fund reserves in Billions.
Click on Graph for larger image.
Many of these programs will suffer similar demographic issues as OASI. So when someone like victor at the Dead Parrot questions the existence of the OASI Trust Fund, he is also speaking to our military, Federal employees, Civil Service workers and many others who are paying into similar retirement insurance plans. Thanks to pgl at Angry Bear and William Polley for reminding me of this issue.


