 RSS Feed
 by Calculated Risk on 8/25/2010 10:51:00 PM
Wednesday, August 25, 2010
Summary and European Bond Spreads
And a couple of posts today:
Best to all.
ATA: "Truck freight tonnage has essentially gone sideways since April 2010"
by Calculated Risk on 8/25/2010 06:31:00 PM
From the American Trucking Association: ATA Truck Tonnage Index Rose 1.5 Percent in July
The American Trucking Associations’ advance seasonally adjusted (SA) For-Hire Truck Tonnage Index increased 1.5 percent in July, although June’s reduction was revised from 1.4 percent to 1.6 percent. The latest improvement raised the SA index from 108.3 (2000=100) in June to 110 in July.
...
Compared with July 2009, SA tonnage climbed 7.4 percent, which matched June’s increase and was the eighth consecutive year-over-year gain. Year-to-date, tonnage is up 6.7 percent compared with the same period in 2009.
ATA Chief Economist Bob Costello said that July’s data didn’t change his outlook for subdued tonnage growth in the months ahead, stating, “The economy is slowing and truck freight tonnage has essentially gone sideways since April 2010.”

This graph from the ATA shows the Truck Tonnage Index since Jan 2006 (no larger image).
This index has been moving sideways for several months ...
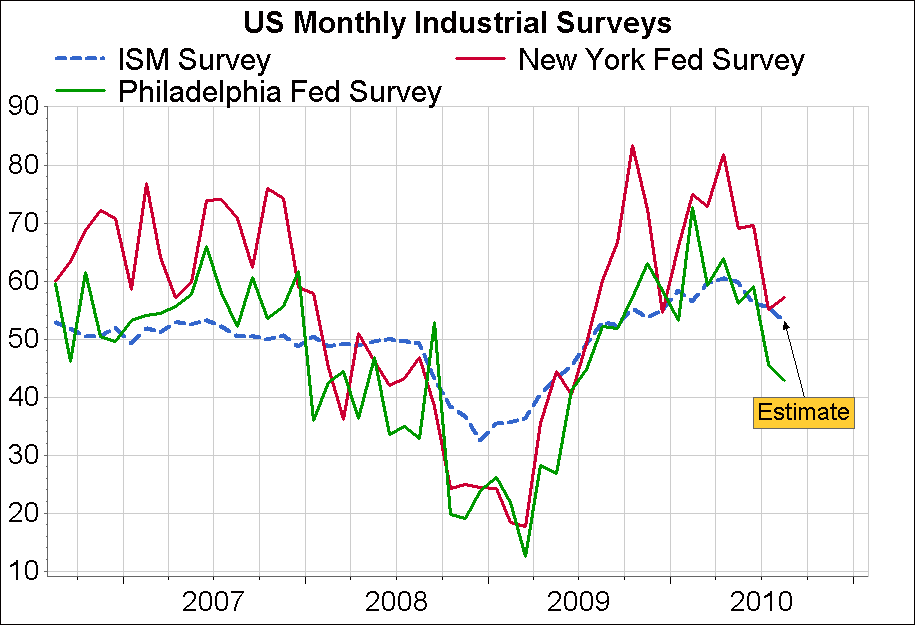
Regional Fed Manufacturing Surveys and the ISM PMI
by Calculated Risk on 8/25/2010 03:05:00 PM
Yesterday, in a short preview of coming negative news, I mentioned that the Institute for Supply Management (ISM) PMI will be released next week (Wed, Sept 1st) - and that the ISM PMI will probably continue to decline based on the regional manufacturing reports.
Gavyn Davies at the Financial Times posted a graph of the New York and Philly Fed surveys compared to the ISM's PMI (ht Paulo). This was referenced in Davies' article: US economy is slowing more than the Fed has recognised
Below is a similar graph.  Click on graph for larger image in new window.
For this graph I averaged the New York and Philly Fed surveys (dashed green), and averaged five surveys including New York, Philly, Richmond, Dallas and Kansas City (blue). The August Kansas City survey will be released tomorrow, and the August Dallas survey will be released on Monday, August 30th.
The PMI (red) is through July.
Based on the regional surveys so far, it appears that the PMI will decline further in August - but still be above 50 (indicating expansion in August).
Home Sales: Distressing Gap
by Calculated Risk on 8/25/2010 12:25:00 PM
This is something I've been tracking for years ... this graph shows existing home sales (left axis) and new home sales (right axis) through July. This graph starts in 1994, but the relationship has been fairly steady back to the '60s. Then along came the housing bubble and bust, and the "distressing gap" appeared (due partially to distressed sales).
Note: it is important to note that existing home sales are counted when transaction are closed, and new home sales are counted when contracts are signed. So the timing of sales is different. Click on graph for larger image in new window.
Initially the gap was caused by the flood of distressed sales. This kept existing home sales elevated, and depressed new home sales since builders couldn't compete with the low prices of all the foreclosed properties.
The two spikes in existing home sales were due primarily to the first time homebuyer tax credit (the initial credit last year, followed by the extension to April 30th / close by June 30th). There were also two smaller bumps for new home sales related to the tax credit.
Since new home sales are reported when contracts are signed, the 2nd spike for new home sales was in April and then sales collapsed in May. The 2nd spike for existing home sales was in May and June, and then existing home sales collapsed in July.
I expect that eventually this gap will be closed. However that will only happen after the huge overhang of existing inventory (especially distressed inventory) is significantly reduced.
New Home Sales decline to Record Low in July
by Calculated Risk on 8/25/2010 10:00:00 AM
The Census Bureau reports New Home Sales in July were at a seasonally adjusted annual rate (SAAR) of 276 thousand. This is an decrease from the record low of 315 thousand in June (revised down from 330 thousand).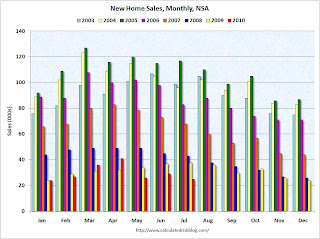 Click on graph for larger image in new window.
The first graph shows monthly new home sales (NSA - Not Seasonally Adjusted or annualized).
Note the Red columns for 2010. In July 2010, 25 thousand new homes were sold (NSA). This is a new record low for July.
The previous record low for the month of July was 31 thousand in 1982; the record high was 117 thousand in July 2005. The second graph shows New Home Sales vs. recessions for the last 47 years.
Sales of new single-family houses in July 2010 were at a seasonally adjusted annual rate of 276,000, according to estimates released jointly today by the U.S. Census Bureau and the Department of Housing and Urban Development. This is 12.4 percent (±10.8%) below the revised June rate of 315,000 and is 32.4 percent (±8.7%) below the July 2009 estimate of 408,000.And another long term graph - this one for New Home Months of Supply.
 Months of supply increased to 9.1 in July from 8.0 in June. The all time record was 12.4 months of supply in January 2009. This is still very high (less than 6 months supply is normal).
The seasonally adjusted estimate of new houses for sale at the end of July was 210,000. This represents a supply of 9.1 months at the current sales rate.
 The final graph shows new home inventory.
 The 276 thousand annual sales rate for July is the all time record low (May was revised up a little). This was another very weak report. New home sales are important for the economy and jobs - and this indicates that residential investment will be a sharp drag on GDP in Q3.
MBA: Mortgage refinance activity increases, Purchase activity flat
by Calculated Risk on 8/25/2010 07:26:00 AM
The MBA reports: Mortgage Refinance Applications Continue to Increase as Rates Decrease
The Refinance Index increased 5.7 percent from the previous week and is at its highest level since May 1, 2009. The seasonally adjusted Purchase Index increased 0.6 percent from one week earlier.
...
“The volume of refi applications last week was up 26% over their level four weeks ago. Mortgage rates dropped to their lowest level in the survey, going back to 1990, as incoming data continue to indicate that economic growth has slowed,” said Michael Fratantoni, MBA’s Vice President of Research and Economics. “We are at a new 15 month high for the Refinance index. With rates this low, many borrowers who refinanced in the past two years may well have an incentive to refinance again, and this is likely increasing refi application activity.”
...
The average contract interest rate for 30-year fixed-rate mortgages decreased to 4.55 percent from 4.60 percent, with points decreasing to 0.89 from .92 (including the origination fee) for 80 percent loan-to-value (LTV) ratio loans. This was the lowest 30-year contract rate ever recorded in the survey.
 Click on graph for larger image in new window.
This graph shows the MBA Purchase Index and four week moving average since 1990.
After falling sharply in May, the purchase index has been moving sideways for three months. The index is 41% below the level of the last week of April (and about 31% below the last week of April using the 4-week average).
This collapse in the purchase index has already shown up as a decline in new home sales (counted when the contract is signed), and existing home sales in July. This suggests little increase in existing home sales in August or September (counted when transactions close).


