 RSS Feed
 by Calculated Risk on 8/19/2010 01:02:00 PM
Thursday, August 19, 2010
Census Bureau: 24.1 million homeowners had primary mortgage rates above 6% in 2009
The Census Bureau released a number of tables from the 2009 American Housing Survey today (report to be released in October).
The survey showed:
 Click on graph for larger image in new window.
This graph shows the number of primary mortgages by interest rate.
Only 6.2 million of primary mortgages were under 5% (as of 2009). This will increase in 2010, but quite a few homeowners had primary mortgage interest rates above 6%. And the BEA recently reported that the effective rate on all mortgages was still above 6% in Q2.
Of course many of these homeowners have second mortgages, or they can't qualify to refinance because or low property values or insufficient income.
It must be very frustrating for these homeowners when they see that Freddie Mac is reporting, via MarketWatch: Fixed-rate mortgages break record low
The 30-year fixed-rate mortgage averaged 4.42% for the week ending Aug. 19, a record low since Freddie started tracking the rate in 1971.There were at least 10.9 million homeowners with 2nd mortgages and another 800 thousand the 3 or more mortgages. Unfortunately that data includes another 5 million homeowners with the number of mortgages not reported.
There is much more data in the tables.
Philly Fed Index shows contraction in August, first time since July 2009
by Calculated Risk on 8/19/2010 10:00:00 AM
Here is the Philadelphia Fed Index: Business Outlook Survey
The survey’s broadest measure of manufacturing conditions, the diffusion index of current activity, decreased from a reading of 5.1 in July to ‐7.7 in August. The index turned negative, marking a period of declining monthly activity for the first time since July 2009 (see Chart). Indexes for new orders and
shipments also suggest a slowing this month; the new orders index fell slightly, to ‐7.1, while the shipments index turned negative, declining to ‐4.5. Indicating weakness, indexes for both delivery times and unfilled orders remained negative this month.
The percentage of firms reporting a decline in employment (23 percent) was higher than the percentage (20 percent) reporting an increase. More concerning was the significant drop in the average employee workweek index from 1.7 in July to ‐17.1 in August.
emphasis added
 Click on graph for larger image in new window.
This graph shows the Philly index for the last 40 years.
This index turned down sharply in June and July and was negative in August for the first time since July 2009.
These surveys are timely, but noisy. However this is further evidence of a 2nd half slowdown.
Weekly initial unemployment claims at 500,000, highest since November 2009
by Calculated Risk on 8/19/2010 08:30:00 AM
The DOL reports on weekly unemployment insurance claims:
In the week ending Aug. 14, the advance figure for seasonally adjusted initial claims was 500,000, an increase of 12,000 from the previous week's revised figure of 488,000. The 4-week moving average was 482,500, an increase of 8,000 from the previous week's revised average of 474,500.
...
The advance number for seasonally adjusted insured unemployment during the week ending Aug. 7 was 4,478,000, a decrease of 13,000 from the preceding week's revised level of 4,491,000.
 Click on graph for larger image in new window.
This graph shows the 4-week moving average of weekly claims since January 2000.
The four-week average of weekly unemployment claims increased this week by 8,000 to 482,500.
The dashed line on the graph is the current 4-week average. This is the highest level for initial claims - and also for the 4-week average - since November 2009.
Wednesday, August 18, 2010
California furloughs back on, Oregon deficit widens
by Calculated Risk on 8/18/2010 07:30:00 PM
From Bob Egelko at the San Francisco Chronicle: Furloughs back on starting this Friday
The state Supreme Court allowed Gov. Arnold Schwarzenegger on Wednesday to resume unpaid furloughs of 144,000 state employees for three days a month, starting this Friday ... The governor ordered the new round of furloughs in late July, claiming executive authority to cut costs while the state faces a $19 billion deficit.And from Michelle Cole at The Oregonian: With projected revenues dropping by as much as $1 billion, Oregon leaders debate what to do (ht Scott)
On Tuesday, Gov. Ted Kulongoski advised legislative leaders, school superintendents and agency directors that state economists expect tax collections to be down significantly more than the $577 million shortfall projected in May. ... Now state economists believe revenues will shrivel by an additional $200 million to $500 million, prompting Kulongoski to send a flurry of letters and notices warning of more cuts to schools and state services.Just a couple reminders that there are more state and local cuts coming ...
Jim the Realtor: "Comp Killer"
by Calculated Risk on 8/18/2010 03:51:00 PM
No, it is not a rap song ...
This is a story from Jim the Realtor about how one REO in a higher mid-priced area of San Diego (North Pacific Beach) has frozen the market. The list prices in this area were all over $500 per sq ft, and this REO sold for under $400 per sq ft.
Comp killer.
The REO is an older home, but with nice interior upgrades and an ocean view. Yeah - the yard needs work.
Refinance Activity, Mortgage Rates and Effective Rate
by Calculated Risk on 8/18/2010 01:11:00 PM
The MBA reported this morning on the surge in refinance activity:
The Refinance Index increased 17.1 percent from the previous week and was the highest Refinance Index observed in the survey since the week ending May 15, 2009. ... The refinance share of mortgage activity increased to 81.4 percent of total applications from 78.1 percent the previous week, which is the highest refinance share observed since January 2009.
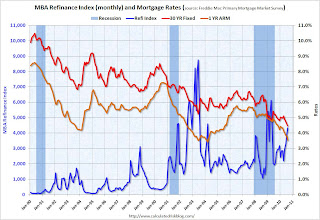 Click on graph for larger image in new window.
The first graph shows the MBA's refinance index (monthly) and the the 30 year fixed rate mortgage interest rate and one year ARM rate, from the Freddie Mac Primary Mortgage Market Survey®.
As mortgage rates have fallen, there has been a surge in refinance activity. But it is still well below the activity during the 2009 refinance boom, or in 2002/2003. It takes lower and lower rates to get people to refi - and many borrowers have insufficient equity (or negative equity) or inadequate income to refi.
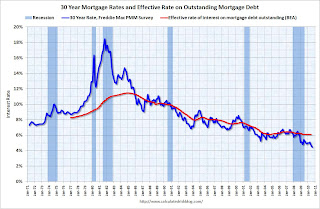 The second graph shows the 30 year fixed rate mortgage interest rate from the Freddie Mac Primary Mortgage Market Survey®.
 The red line is a quarterly estimate from the BEA of the effective rate of interest on all outstanding mortgages (Owner- and Tenant-occupied residential housing through Q2 2010).
The effective rate on outstanding mortgages is at a series low of just over 6%, but the rate is moving down slowly since so many borrowers can't refinance because they do not qualify (either because the property value is too low or their incomes are insufficient).
Because of the difference between current mortgage rates and the effective rate, many people are pushing for programs to help unqualified borrowers to refinance. As an example, PIMCO's Bill Gross suggested
Mr. Gross said the U.S. could easily refinance every current mortgage borrower, who is paying a rate above 5%, with a loan backed by Fannie Mae, Freddie Mac, and the Federal Housing Administration, returning tens of billions in savings.This will not happen unless the private lenders write down the principal - and that is very unlikely.


