 RSS Feed
 by Calculated Risk on 4/02/2015 02:49:00 PM
Thursday, April 02, 2015
Preview for March Employment Report
Friday at 8:30 AM ET, the BLS will release the employment report for March. The consensus, according to Bloomberg, is for an increase of 247,000 non-farm payroll jobs in March (with a range of estimates between 200,000 and 271,000), and for the unemployment rate to be unchanged at 5.5%.
The BLS reported 295,000 jobs added in February.
First, from Goldman Sachs economist David Mericle: "We expect nonfarm payroll job growth of 220k in March, below the consensus forecast of 245k. Labor market indicators were generally flat or weaker in March, suggesting payroll growth somewhat below the recent trend. We expect the unemployment rate to remain unchanged at 5.5% and average hourly earnings to rise 0.2%, roughly in line with the recent trend rate of wage growth."
Here is a summary of recent data:
• The ADP employment report showed an increase of 189,000 private sector payroll jobs in March. This was below expectations of 225,000 private sector payroll jobs added. The ADP report hasn't been very useful in predicting the BLS report for any one month, but in general, this suggests employment growth below expectations.
• The ISM manufacturing employment index decreased in March to 50.0%. A historical correlation between the ISM manufacturing employment index and the BLS employment report for manufacturing, suggests that private sector BLS manufacturing payroll jobs declined by 20,000 in March. The ADP report indicated a 1,000 decrease for manufacturing jobs in March.
The ISM non-manufacturing employment index will not be released until Monday.
• Initial weekly unemployment claims averaged close to 285,000 in March, down from 305,000 in February. For the BLS reference week (includes the 12th of the month), initial claims were at 293,000; this was up from 285,000 during the reference week last month.
Generally this suggests fewer layoffs, seasonally adjusted, in March compared to February.
• The final March University of Michigan consumer sentiment index decreased to 93.0 from the February reading of 95.4. Sentiment is frequently coincident with changes in the labor market, but this decrease is probably mostly due to an increase in gasoline prices in early March.
• Trim Tabs reported that the U.S. economy added 268,000 in March. This was up from their 215,000 and 245,000 range last month. "TrimTabs’ employment estimates are based on analysis of daily income tax deposits to the U.S. Treasury from the paychecks of the 141 million U.S. workers subject to withholding".
• On small business hiring: The small business index from Intuit showed a 15,000 increase in small business employment in March, up from 10,000 added in February.
Also on small business, NFIB reported: “Reported hiring in March was one of the best readings in the last decade eclipsing the substantial readings in January and February, but this might have reflected the heavy hiring over the past three months.”
• Conclusion: There is always some randomness to the employment report, and the indicators were mixed in March. Manufacturing employment was probably down (especially in petroleum industries, and also due to the West Coast port slowdown). However small business employment was probably up.
 This graph shows the year-over-year change in total non-farm employment since 1968.
In February, the year-over-year change was 3.3 million jobs. Last March, the economy added 225,000 jobs according to the BLS, so anything above 225,000 (including revisions) will increase the year-over-year change (already highest since the '90s).
Reis: Apartment Vacancy Rate decreased in Q1 to 4.1%
by Calculated Risk on 4/02/2015 11:47:00 AM
Reis reported that the apartment vacancy rate declined in Q1 2015 to 4.1%, down from 4.2% in Q4 2014, and the same as in Q1 2014. The vacancy rate peaked at 8.0% at the end of 2009.
A few comments from Reis Senior Economist and Director of Research Ryan Severino:
The apartment market pulled a bit of a surprise during the first quarter of 2015. After appearing to reach an inflection point last year, beyond which the national vacancy rate would continue rising, vacancy actually declined by 10 basis points to 4.1%. This decrease in vacancy was primarily due to relatively weak new completions during the first quarter. Although weak first quarters for completions has become a bit of a norm in recent years as seasonality has returned to the market, it is a bit surprising this year because of the large pipeline of projects slated to come online in 2015, including many new units that were supposed to be completed last year but were delayed until this year. On the other side of the ledger, demand remains relatively robust as we projected it would.
...
The 4.1% vacancy rate matches the cyclical low that was attained during the first half of 2014. The decline was predominantly due to relatively weak supply growth during the quarter – although demand exceeded supply, net absorption was also relatively weak during the quarter as is usually wont to happen during the first quarter of calendar years. Despite this quarter’s decline, over the last twelve months the national vacancy rate was unchanged, indicating that the national vacancy rate has likely bottomed and should rise during the balance of 2015. The massive amounts of new supply that are coming online over the next few years should exceed demand which will gradually push the vacancy rate upward. However, due to the large number of individuals between the ages of 20 and 29 in the US, demand will remain relatively stout which will cause vacancy to rise at a somewhat measured pace.
Asking and effective rents both grew by 0.6% during the first quarter. This also follows the slowing trend of the last few quarters, but seasonality was likely a factor in this lack of acceleration versus the fourth quarter of 2014. The deceleration in rent growth in recent quarters has caused even the year-over-year growth rate to decline. Over the last four quarters, rent growth for asking and effective rents was 3.4% and 3.5%, respectively.
emphasis added
 Click on graph for larger image.
This graph shows the apartment vacancy rate starting in 1980. (Annual rate before 1999, quarterly starting in 1999). Note: Reis is just for large cities.
Apartment vacancy data courtesy of Reis.
Trade Deficit decreased in February to $35.4 Billion
by Calculated Risk on 4/02/2015 08:54:00 AM
The Department of Commerce reported:
The U.S. Census Bureau and the U.S. Bureau of Economic Analysis, through the Department of Commerce, announced today that the goods and services deficit was $35.4 billion in February, down $7.2 billion from $42.7 billion in January, revised. February exports were $186.2 billion, $3.0 billion less than January exports. February imports were $221.7 billion, $10.2 billion less than January imports.The trade deficit smaller than the consensus forecast of $41.5 billion.
The first graph shows the monthly U.S. exports and imports in dollars through February 2015.
 Click on graph for larger image.
Imports and exports decreased in February (probably due to impact of West Coast port slowdown).
Exports are 12% above the pre-recession peak and down 1% compared to February 2014; imports are 4% below the pre-recession peak, and down 4% compared to February 2014.
The second graph shows the U.S. trade deficit, with and without petroleum.
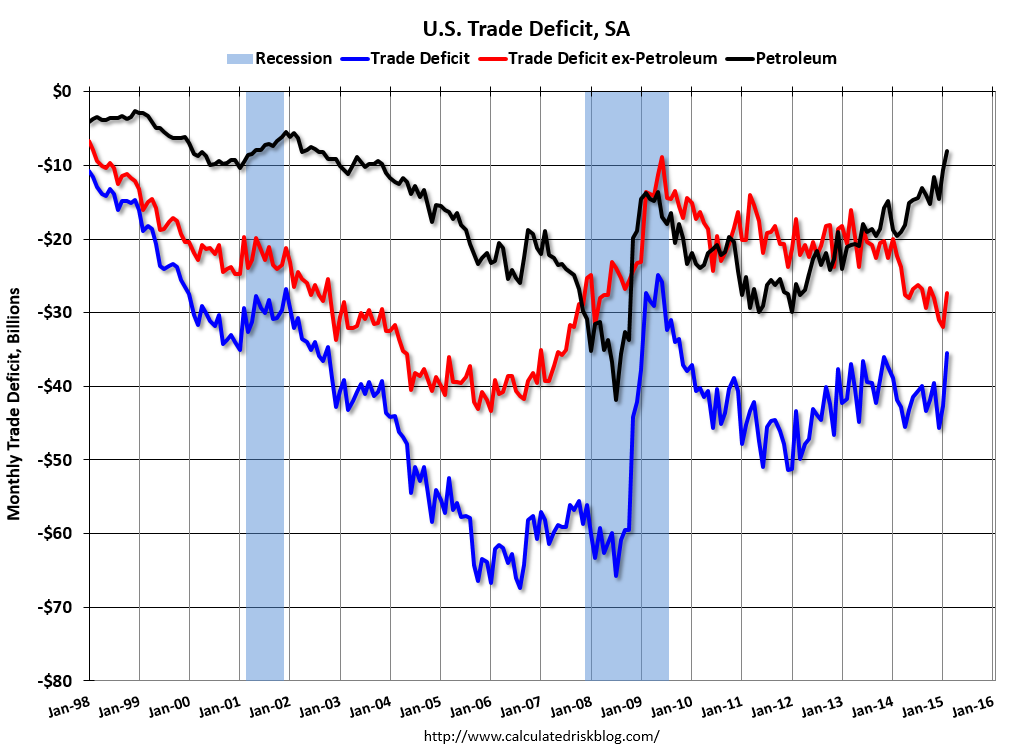 The blue line is the total deficit, and the black line is the petroleum deficit, and the red line is the trade deficit ex-petroleum products.
Oil imports averaged $49.53 in February, down from $58.96 in January, and down from $91.53 in February 2014. The petroleum deficit has generally been declining and is the major reason the overall deficit has declined since early 2012.
Oil prices will probably increase a little in the March report. Note: There is a lag due to shipping and long term contracts.
The trade deficit with China increased to $22.5 billion in February, from $20.8 billion in February 2014. The deficit with China is a large portion of the overall deficit.
The decrease in the trade deficit was due to a lower volume and lower price of oil imports, and the West Coast port slowdown. Oil prices will probably be a little higher in March, and trade will be up sharply at the West Coast ports.
Weekly Initial Unemployment Claims decreased to 268,000
by Calculated Risk on 4/02/2015 08:30:00 AM
The DOL reported:
In the week ending March 28, the advance figure for seasonally adjusted initial claims was 268,000, a decrease of 20,000 from the previous week's revised level. The previous week's level was revised up by 6,000 from 282,000 to 288,000. The 4-week moving average was 285,500, a decrease of 14,750 from the previous week's revised average. The previous week's average was revised up by 3,250 from 297,000 to 300,250.The previous week was revised up to 288,000.
There were no special factors impacting this week's initial claims.
The following graph shows the 4-week moving average of weekly claims since January 2000.
 Click on graph for larger image.
The dashed line on the graph is the current 4-week average. The four-week average of weekly unemployment claims decreased to 285,500.
This was below the consensus forecast of 285,000, and the low level of the 4-week average suggests few layoffs.
Wednesday, April 01, 2015
Thursday: Trade Deficit, Unemployment Claims
by Calculated Risk on 4/01/2015 08:09:00 PM
Update to "It never rains in California" ... from the Sacramento Bee: Jerry Brown orders mandatory water reductions amid California drought
With California slogging into its fourth year of withering drought, Gov. Jerry Brown on Wednesday ordered mandatory water reductions of 25 percent in cities and towns across the state.Thursday:
...
The snowpack, which typically accounts for about 30 percent of California’s water supply, has been declining since the first manual survey of the season, in December. According to the most recent electronic readings, it now stands at its lowest level in recorded history, just 8 percent of average.
• 8:30 AM ET, the initial weekly unemployment claims report will be released. The consensus is for claims to increase to 285 thousand from 282 thousand.
• At 8:30 AM, the Trade Balance report for February from the Census Bureau. The consensus is for the U.S. trade deficit to be at $41.5 billion in February from $41.8 billion in January.
• Early: Reis Q1 2015 Apartment Survey of rents and vacancy rates.
• At 10:00 AM, Manufacturers' Shipments, Inventories and Orders (Factory Orders) for February. The consensus is for no change in February orders.


