 RSS Feed
 by Calculated Risk on 12/16/2014 08:30:00 AM
Tuesday, December 16, 2014
Housing Starts decrease to 1.028 Million Annual Rate in November
From the Census Bureau: Permits, Starts and Completions
Housing Starts:
Privately-owned housing starts in November were at a seasonally adjusted annual rate of 1,028,000. This is 1.6 percent below the revised October estimate of 1,045,000 and is 7.0 percent below the November 2013 rate of 1,105,000.
Single-family housing starts in November were at a rate of 677,000; this is 5.4 percent below the revised October figure of 716,000. The November rate for units in buildings with five units or more was 340,000.
emphasis added
Building Permits:
Privately-owned housing units authorized by building permits in November were at a seasonally adjusted annual rate of 1,035,000. This is 5.2 percent below the revised October rate of 1,092,000 and is 0.2 percent below the November 2013 estimate of 1,037,000.
Single-family authorizations in November were at a rate of 639,000; this is 1.2 percent below the revised October figure of 647,000. Authorizations of units in buildings with five units or more were at a rate of 367,000 in November.
 Click on graph for larger image.
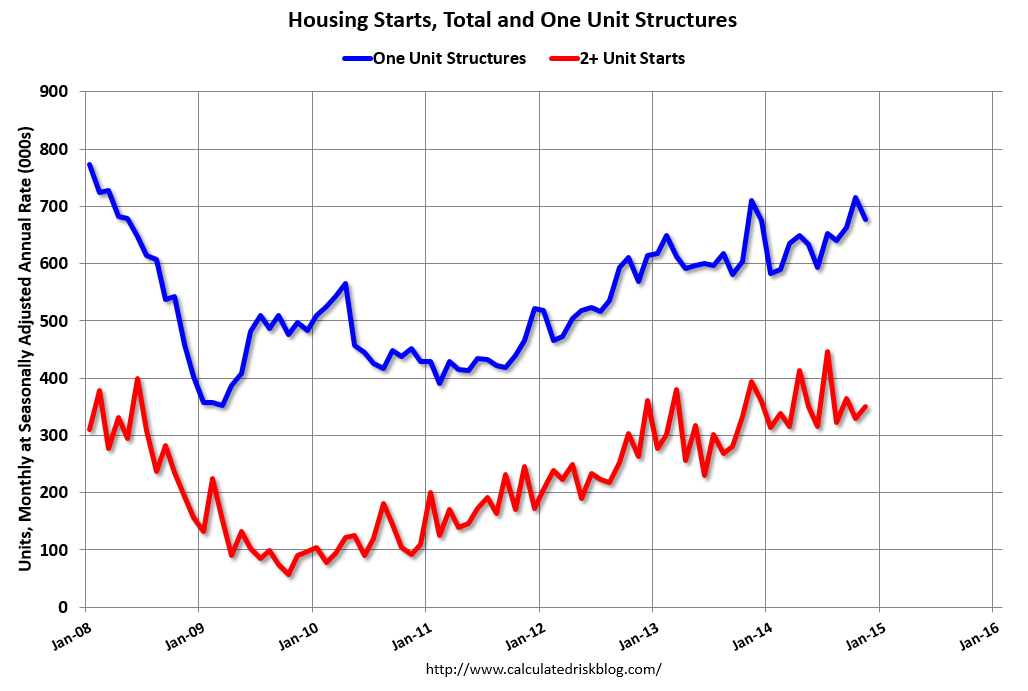
The first graph shows single and multi-family housing starts for the last several years.
Multi-family starts (red, 2+ units) increased in November (Multi-family is volatile month-to-month). Multi-family starts are down 11% year-over-year because there was a large increase in starts last November.
Single-family starts (blue) decreased in November.
The second graph shows total and single unit starts since 1968.
 The second graph shows the huge collapse following the housing bubble, and that housing starts have been increasing after moving sideways for about two years and a half years.
 This was below expectations of 1.038 million starts in November, however October was revised up by 36 thousand (annual rate), so overall this was a decent report. The comparison to last year was difficult because of the large increase in starts in November 2013 (that probably was one of the reasons many analysts were too optimistic for 2014). I'll have more later ...
Monday, December 15, 2014
Tuesday: Housing Starts
by Calculated Risk on 12/15/2014 08:32:00 PM
Two related articles ...
From the NY Times: Russia’s Central Bank Abruptly Raises Key Rate to 17%
With Russia scrambling to contain a currency crisis, the country’s central bank, in a surprise middle-of-the-night move, increased its key interest rate to 17 percent, from 10.5 percent.From the WSJ: Oil Prices Fall to Fresh Lows
...
The rate increase came after the ruble plummeted yet again on Monday, by more than 10 percent, to around 64 per dollar. The ruble has lost nearly half its value this year.
Oil for January delivery fell $1.90, or 3.3%, to close at $55.91 a barrel, the lowest level since May 2009 on the New York Mercantile Exchange.There is more to the ruble collapse than declining oil prices, but it is a huge factor.
Brent crude, the global benchmark, slid 1.3% to $61.06 a barrel, the lowest level since July 2009, on ICE Futures Europe.
Tuesday:
• At 8:30 AM ET, Housing Starts for November. Total housing starts were at 1.009 million (SAAR) in October. Single family starts were at 696 thousand SAAR in October. The consensus is for total housing starts to increase to 1.038 million (SAAR) in November.
Lawler: Updated Table of Distressed Sales and Cash buyers for Selected Cities in November
by Calculated Risk on 12/15/2014 06:25:00 PM
Economist Tom Lawler sent me the updated table below of short sales, foreclosures and cash buyers for a few selected cities in November.
On distressed: Total "distressed" share is down in these markets mostly due to a decline in short sales (the Mid-Atlantic and Orlando were unchanged).
Short sales are down significantly in these areas.
Foreclosures are up in several areas (working through the logjam).
The All Cash Share (last two columns) is declining year-over-year. As investors pull back, the share of all cash buyers will probably continue to decline.
| Short Sales Share | Foreclosure Sales Share | Total "Distressed" Share | All Cash Share | |||||
|---|---|---|---|---|---|---|---|---|
| Nov-14 | Nov-13 | Nov-14 | Nov-13 | Nov-14 | Nov-13 | Nov-14 | Nov-13 | |
| Las Vegas | 9.5% | 21.0% | 8.7% | 7.0% | 18.2% | 28.0% | 32.8% | 43.7% |
| Reno** | 6.0% | 17.0% | 6.0% | 6.0% | 12.0% | 23.0% | ||
| Phoenix | 4.1% | 7.8% | 5.7% | 8.0% | 9.7% | 15.8% | 28.0% | 34.0% |
| Sacramento | 6.1% | 11.0% | 5.4% | 4.6% | 11.5% | 15.6% | 16.9% | 25.0% |
| Minneapolis | 3.1% | 5.0% | 10.2% | 16.9% | 13.4% | 21.9% | ||
| Mid-Atlantic | 4.7% | 7.5% | 11.0% | 8.1% | 15.7% | 15.7% | 19.1% | 19.6% |
| Orlando | 6.2% | 13.7% | 27.8% | 20.3% | 34.0% | 34.0% | 42.1% | 46.2% |
| So. California* | 6.2% | 10.5% | 5.3% | 6.3% | 11.5% | 16.8% | 23.9% | 28.1% |
| Northeast Florida | 29.7% | 38.1% | ||||||
| Chicago (City) | 20.2% | 32.8% | ||||||
| Hampton Roads | 20.4% | 26.9% | ||||||
| Toledo | 35.4% | 37.2% | ||||||
| Tucson | 26.3% | 32.2% | ||||||
| Des Moines | 19.3% | 19.9% | ||||||
| Peoria | 19.7% | 21.8% | ||||||
| Georgia*** | 26.5% | N/A | ||||||
| Omaha | 21.1% | 21.6% | ||||||
| Memphis* | 15.1% | 20.5% | ||||||
| Springfield IL** | 11.8% | 17.6% | ||||||
| *share of existing home sales, based on property records **Single Family Only ***GAMLS | ||||||||
Lawler: Early Read on Existing Home Sales in November (look for big dip)
by Calculated Risk on 12/15/2014 04:06:00 PM
From housing economist Tom Lawler
Based on local realtor/MLS reports from across the country, I estimate that US existing home sales as measured by the National Association of Realtors ran at a seasonally adjusted annual rate of about 4.93 million in November, down 6.3% from October’s preliminary pace but up 2.1% from last November’s pace. On the inventory front, the vast majority of local reports showed a larger monthly decline in listings this November compared to last November, and I estimate that the inventory of existing homes for sale as measured by the NAR for the end of November will be 2.12 million, down 4.5% from October and up 3.4% from a year ago.
Finally, a median existing SF home sales price for November that was up about 4.7% from last November would be consistent with local realtor/MLS reports. On this latter point, I should note that the YOY increases shown in the NAR’s median sales prices for the last several months have been higher than local realtor/MLS reports would have suggested.
CR Note: Existing home sales will be released next week on Monday, December 22nd.
A Comment on Oil Prices
by Calculated Risk on 12/15/2014 02:20:00 PM
Recently there has been a dramatic decline in oil prices. This has led to some wild and confusing articles. As an example, Barry Ritholtz excerpted from an article that started: "Most observers thought the Organization of Petroleum Exporting Countries (OPEC) would cut its production to protect its members’ incomes and slash frackers’ profits."
That is wrong. If OPEC cut production, that would help the frackers (not hurt them). And most analysts I know didn't except OPEC to cut production.
For example, from Professor Hamilton on Oct 19th: How will Saudi Arabia respond to lower oil prices?
Oil prices (along with prices of many other commodities) have fallen dramatically since last summer. Some observers are waiting to see if Saudi Arabia responds with significant cutbacks in production. I say, don’t hold your breath.So it was no surprise that OPEC didn't cut production.
...
[In October] I discussed the three main factors in the recent fall in oil prices: (1) signs of a return of Libyan production to historical levels, (2) surging production from the U.S., and (3) growing indications of weakness in the world economy.
As far as Libya is concerned, the politics on the ground remain quite unsettled. It makes sense to wait and see if anticipated production gains are really going to hold before anybody makes major adjustments.
In terms of surging U.S. production, the key question is how low the price can get before significant numbers of U.S. producers decide to pull out. If world economic growth indeed slows, and if most of the frackers are willing to keep going strong ... trying to maintain the price ... could be a losing bet for the Saudis. They’d be giving up their own revenue just in order to keep the money flowing into ever-growing operations in Texas and North Dakota.
...
And as for worries of another global economic downturn, so far they are only that– worries. If and when we see a downturn materialize, then I would expect to see the Saudis cut back production.
But until then it’s primarily a question of responding to surging output of U.S. tight oil. My guess is that Saudi Arabia would lower prices rather than cut production as long as that’s the name of the game.
emphasis added
And the speculation that oil producers are trying to hurt Iran, Russia, or terrorists ... that is also incorrect.
The reason prices have fallen sharply is supply and demand. It is important to remember that the short term supply and demand curves for oil are very steep.
If there is little unused capacity, it takes time for more oil production to become available since this involves huge capital intensive projects. And, in the short term, demand is fairly inelastic over a wide range of prices; for the most part people stay with their routines and keep their same vehicle. With two steep curves (supply and demand) we get the following:
 Click on graph for larger image.
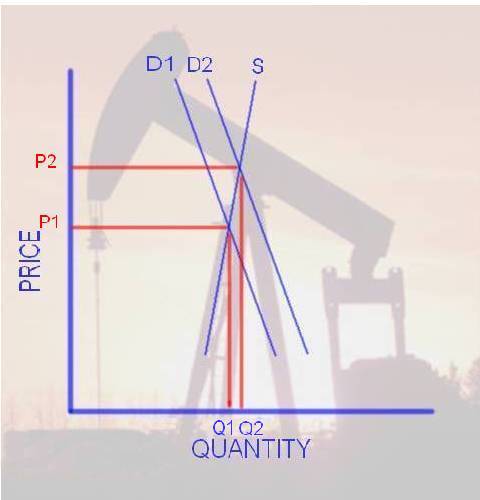
This is a graph I post in 2005. Back in 2005, I pointed out that with a small increase in Demand (from D1 to D2), we would see a small increase in Quantity (Q1 to Q2), but a large change in Price (from P1 to P2). Also a large price increase would also occur if we had a small decrease in supply such as a disruption to production, transport or refining.
And the opposite is also true. A relatively small decrease in demand or increase in supply (fracking) could cause a significant decline in prices. Especially now with OPEC's diminished role (since cutting production helps other producers).
In the long run, supply and demand will adjust to price changes. But if someone asks why prices have fallen so sharply recently, the answer is "supply and demand" and that the short term supply and demand curves are steep for oil.


