 RSS Feed
 by Calculated Risk on 11/14/2014 10:05:00 AM
Friday, November 14, 2014
MBA: Mortgage Delinquency and Foreclosure Rates Decrease in Q3, Lowest since 2007
From the MBA: Mortgage Delinquencies Continue to Decrease in Third Quarter
The delinquency rate for mortgage loans on one-to-four-unit residential properties decreased to a seasonally adjusted rate of 5.85 percent of all loans outstanding at the end of the third quarter of 2014. The delinquency rate decreased for the sixth consecutive quarter and reached the lowest level since the fourth quarter of 2007. The delinquency rate decreased 19 basis points from the previous quarter, and 56 basis points from one year ago, according to the Mortgage Bankers Association’s (MBA) National Delinquency Survey.
The delinquency rate includes loans that are at least one payment past due but does not include loans in the process of foreclosure. The percentage of loans in the foreclosure process at the end of the third quarter was 2.39 percent, down 10 basis points from the second quarter and 69 basis points lower than one year ago. This was the lowest foreclosure inventory rate seen since the fourth quarter of 2007.
...
“Delinquency rates and the percentage of loans in foreclosure fell to their lowest levels since 2007,” said Mike Fratantoni, MBA’s chief economist. “We are now back to pre-crisis levels for most measures. Foreclosure starts were unchanged on a seasonally adjusted basis, but increased slightly in the raw data. Given that this measure reached the lowest level in eight years last quarter, and given the continued decline in delinquency and foreclosure inventory rates, we expect that the increase in the unadjusted starts rate is just regular seasonal fluctuation.”
...
“On an aggregated basis, both judicial and non-judicial states saw decreases in loans in foreclosure, although the judicial states continue to have a combined foreclosure inventory rate that is around three times that of non-judicial states. New Jersey continues to lead the nation in loans in foreclosure, although it saw another decrease from the previous quarter. Florida, once with the highest percentage of loans in foreclosure, experienced a significant decrease in the third quarter."
emphasis added
 Click on graph for larger image.
This graph shows the percent of loans delinquent by days past due.
The percent of loans 30 days and 60 days delinquent are back to normal levels.
The 90 day bucket peaked in Q1 2010, and is more than two-thirds of the way back to normal.
The percent of loans in the foreclosure process also peaked in 2010 and is two-thirds of the way back to normal.
So it has taken about 4 years to reduce the backlog of seriously delinquent and in-foreclosure loans by two-thirds, so a rough guess is that serious delinquencies and foreclosure inventory will be back to normal in a couple more years. Most other measures are already back to normal (still working through the backlog).
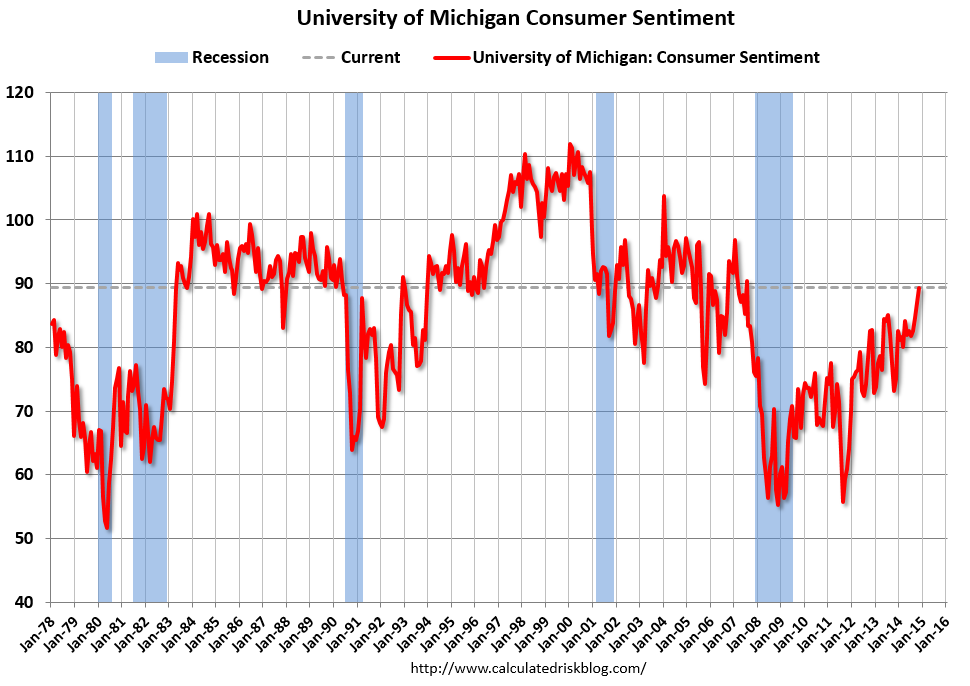
Preliminary November Consumer Sentiment increases to 89.4
by Calculated Risk on 11/14/2014 09:55:00 AM
Click on graph for larger image.
The preliminary Reuters / University of Michigan consumer sentiment index for November was at 89.4, up from 86.9 in October.
This was above the consensus forecast of 87.5 and is at the highest level since 2007.
Retail Sales increased 0.3% in October
by Calculated Risk on 11/14/2014 08:43:00 AM
On a monthly basis, retail sales decreased 0.3% from September to October (seasonally adjusted), and sales were up 4.1% from October 2013. Sales in September were unrevised at a 0.3% decrease.
From the Census Bureau report:
The U.S. Census Bureau announced today that advance estimates of U.S. retail and food services sales for October, adjusted for seasonal variation and holiday and trading-day differences, but not for price changes, were $444.5 billion, an increase of 0.3 percent from the previous month, and 4.1 percent above October 2013. ... The August to September 2014 percent change was unrevised from -0.3%.
 Click on graph for larger image.
This graph shows retail sales since 1992. This is monthly retail sales and food service, seasonally adjusted (total and ex-gasoline).
Retail sales ex-gasoline increase 0.5%.
Retail sales ex-autos increased 0.3%.
The second graph shows the year-over-year change in retail sales and food service (ex-gasoline) since 1993.
 Retail sales ex-gasoline increased by 5.1% on a YoY basis (4.1% for all retail sales).
The increase in October was above consensus expectations of a 0.2% increase.
Overall this was a solid report.
Thursday, November 13, 2014
Friday: Retail Sales, Consumer Sentiment, Q3 National Mortgage Delinquency Survey
by Calculated Risk on 11/13/2014 07:01:00 PM
One of the keys in the retail sales report will be sales ex-gasoline. From the WSJ: On Your Shopping List: Three Things to Watch in the Retail Sales Report
[C]onsider retail performance excluding gasoline stations. Retail sales are reported nominally and gas prices have plummeted since June. That means a clearer picture of the consumer sector will come from looking at retail sales excluding gas stations.Friday:
There are two reasons for that. The first is obvious: If gas sales are falling, sales excluding gas are doing better than total sales.
The second reason is that cheaper gas frees up money that can be spent elsewhere. If nongas sales don’t post a solid gain in October, consumers may be saving that extra money.
• At 8:30 AM ET, Retail sales for October will be released. The consensus is for retail sales to increase 0.2% in October, and to increase 0.2% ex-autos.
• At 9:55 AM, the Reuter's/University of Michigan's Consumer sentiment index (preliminary for November). The consensus is for a reading of 87.5, up from 86.9 in October.
• At 10:00 AM, the Mortgage Bankers Association (MBA) Q3 2014 National Delinquency Survey (NDS).
• Also at 10:00 AM, the Manufacturing and Trade: Inventories and Sales (business inventories) report for September. The consensus is for a 0.3% increase in inventories.
Freddie Mac: "Fixed Mortgage Rates Hovering Near 2014 Lows"
by Calculated Risk on 11/13/2014 05:03:00 PM
From Freddie Mac: Fixed Mortgage Rates Hovering Near 2014 Lows
Freddie Mac today released the results of its Primary Mortgage Market Survey® (PMMS®), showing average fixed mortgage rates little changed from the previous week with the 30-year mortgage still hovering around 4 percent.
30-year fixed-rate mortgage (FRM) averaged 4.01 percent with an average 0.5 point for the week ending November 13, 2014, down from last week when it averaged 4.02 percent. A year ago at this time, the 30-year FRM averaged 4.35 percent.
 Click on graph for larger image.
Here is a graph of 30 year fixed mortgage rates - according to the PMMS® - for 2010 through 2014 (red).
Mortgage rates are lower this year than last year (blue), and at about the same level as in 2011.
Note: Looking at daily rates from Mortgage News Daily, 30 year rates are at 4.05% today, down from 4.46% one year ago. The MND data is based on actual lender rate sheets, and is mostly "the average no-point, no-origination rate for top-tier borrowers with flawless scenarios". (this tracks the Freddie Mac series very well).


