 RSS Feed
 by Calculated Risk on 7/18/2012 11:47:00 AM
Wednesday, July 18, 2012
August 1st QE3 Departure Date?
There is quite a bit of discussion on when (not if) the Fed will embark on QE3. As an example, from Goldman Sachs yesterday:
While we think that a modest easing step is a strong possibility at the August or September meeting, we suspect that a large move is more likely to come after the election or in early 2013, barring rapid further deterioration in the already-cautious near term Fed economic outlook.And from Merrill Lynch this morning:
We expect that, as the data continue to soften, the Fed will undershoot its own forecasts and thus respond with further easing. We expect the Fed to push out its forward guidance until at least mid-2015, perhaps at the August 1 FOMC meeting, and to launch a $500bn QE3 asset purchase plan by the September 13 meeting.Although the date is uncertain, I think there is a strong possibility that the Fed will launch QE3 on August 1st.
First, I think Bernanke paved the way for QE3 at the press conference on June 20th. Before embarking on previous rounds of QE, Bernanke always outlined the reasons - and I thought he made it clear that if the economy didn't improve, more accommodation was coming. And, if anything, the data has been worse since the last meeting. However there has only been a limited amount of data (Q2 GDP will be released next week), and some participants might argue they need additional data before supporting QE3.
Second, two of the key undecided voting members of the FOMC are clearly moving closer to supporting QE3. Last week Atlanta Fed President Dennis Lockhart came close to advocating QE3. Although Lockhart weighed both sides of each issue in his speech, he concluded: 1) the risks of QE3 are "manageable", 2) QE3 will be modestly effective, and 3) his earlier forecast is becoming "untenable" and that means he will support more accommodation if the recent weak data continues.
And yesterday, Cleveland Fed President Sandra Pianalto said more easing could be warranted.
My outlook calls for the pace of growth to pick up over the course of this year and into 2013 as the headwinds holding back the recovery gradually abate. I also expect inflation to remain close to 2 percent. If the expansion were to continue to lose momentum, and inflation threatened to run persistently below 2 percent, additional policy action could be warranted.I expect Pianalto will revise down her outlook over the next couple of weeks.
Third, it appears some key members of the FOMC (Yellen, Dudley, Williams) are all pushing harder for QE now. San Francisco Fed President John Williams is definitely being more aggressive, from July 9th:
We are falling short on both our employment and price stability mandates, and I expect that we will make only very limited progress toward these goals over the next year. ... If further action is called for, the most effective tool would be additional purchases of longer-maturity securities, including agency mortgage-backed securities. ... At the Fed, we take our dual mandate with the utmost seriousness. ... We stand ready to do what is necessary to attain our goals of maximum employment and price stability.By my count, if Bernanke decides that QE3 is appropriate, he will have 10 or 11 votes on August 1st. Maybe the FOMC will wait for more data, but I think QE3 is likely very soon.
AIA: Architecture Billings Index shows "drop in design activity" in June
by Calculated Risk on 7/18/2012 10:41:00 AM
Note: This index is a leading indicator primarily for new Commercial Real Estate (CRE) investment.
From AIA: Weak Market Conditions Persist According to Architecture Billings Index
The Architecture Billings Index (ABI) saw more poor conditions last month, indicating a drop in design activity at U.S. architecture firms, and suggesting upcoming weakness in spending on nonresidential construction projects. As a leading economic indicator of construction activity, the ABI reflects the approximate nine to twelve month lag time between architecture billings and construction spending. The American Institute of Architects (AIA) reported the June ABI score was 45.9, nearly identical to the mark of 45.8 in May. This score reflects a decrease in demand for design services (any score above 50 indicates an increase in billings). The new projects inquiry index was 54.4, up slightly from mark of 54.0 the previous month.
“The downturn in design activity that began in April and accelerated in May has continued into June, likely extending the weak market conditions we’ve seen in nonresidential building activity ,” said AIA Chief Economist, Kermit Baker, PhD, Hon. AIA. “While not all firms are experiencing negative conditions, a large share is still coping with a sluggish and erratic marketplace.”
 Click on graph for larger image.
This graph shows the Architecture Billings Index since 1996. The index was at 45.9 in June, up slightly from May. Anything below 50 indicates contraction in demand for architects' services.
Note: This includes commercial and industrial facilities like hotels and office buildings, multi-family residential, as well as schools, hospitals and other institutions.
According to the AIA, there is an "approximate nine to twelve month lag time between architecture billings and construction spending" on non-residential construction. This suggests further weakness in CRE investment later this year and into next year (it will be some time before investment in offices and malls increases).
Housing Starts increased to 760 thousand in June, Highest since October 2008
by Calculated Risk on 7/18/2012 08:30:00 AM
From the Census Bureau: Permits, Starts and Completions
Housing Starts:
Privately-owned housing starts in June were at a seasonally adjusted annual rate of 760,000. This is 6.9 percent above the revised May estimate of 711,000 and is 23.6 percent above the June 2011 rate of 615,000.
Single-family housing starts in June were at a rate of 539,000; this is 4.7 percent above the revised May figure of 515,000. The June rate for units in buildings with five units or more was 213,000.
Building Permits:
Privately-owned housing units authorized by building permits in June were at a seasonally adjusted annual rate of 755,000. This is 3.7 percent below the revised May rate of 784,000, but is 19.3 percent above the June 2011 estimate of 633,000.
Single-family authorizations in June were at a rate of 493,000; this is 0.6 percent above the revised May figure of 490,000. Authorizations of units in buildings with five units or more were at a rate of 241,000 in June.
 Click on graph for larger image.
Total housing starts were at 760 thousand (SAAR) in June, up 6.9% from the revised May rate of 711 thousand (SAAR). Note that May was revised up from 708 thousand. April was revised up slightly too.
Single-family starts increased 4.7% to 539 thousand in June.
The second graph shows total and single unit starts since 1968.
 This shows the huge collapse following the housing bubble, and that total housing starts have been increasing lately after moving sideways for about two years and a half years.
 Total starts are up 59% from the bottom start rate, and single family starts are up 53% from the low.
This was above expectations of 745 thousand starts in June. This is another fairly strong housing report.
MBA: "Record Low Mortgage Rates Lead to Jump in Refinance Activity"
by Calculated Risk on 7/18/2012 07:04:00 AM
From the MBA: Record Low Mortgage Rates Lead to Jump in Refinance Activity
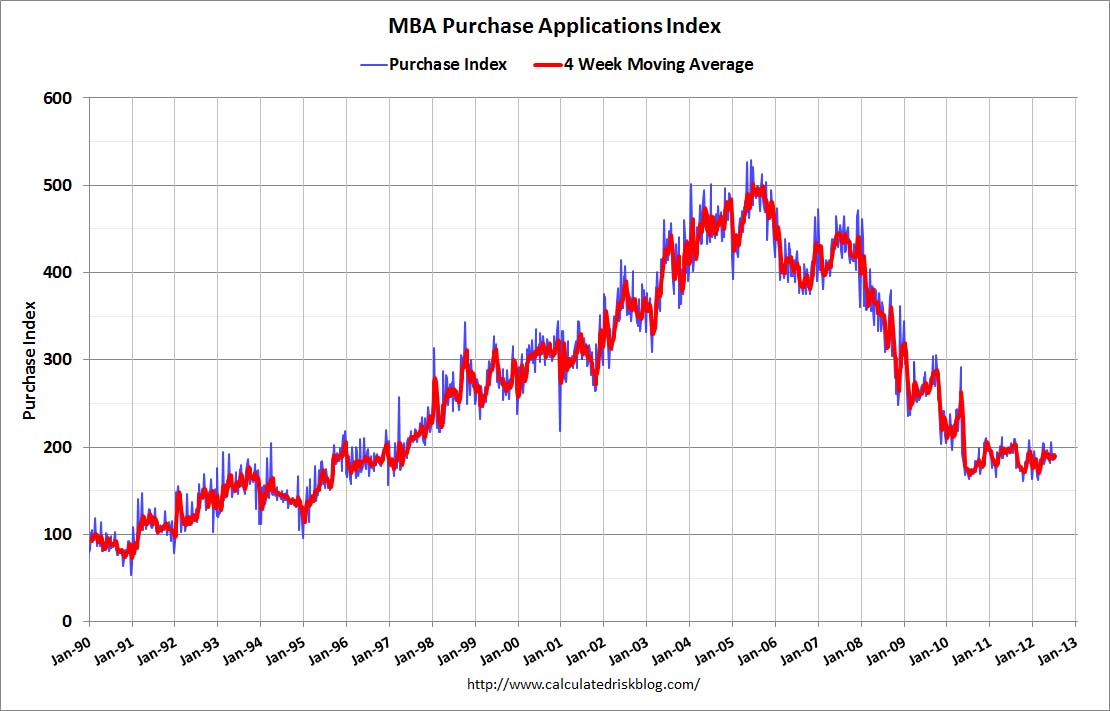
The Refinance Index increased 22 percent from the previous week and is at the highest level since mid-June. The seasonally adjusted Purchase Index decreased 0.1 percent from one week earlier.
“Refinance application volume increased last week to near peak levels for the year as mortgage rates dropped to a new low, driven down by growing concerns about the health of the US economy,” said Mike Fratantoni, MBA’s Vice President of Research and Economics. “Applications for HARP refinance loans accounted for 24 percent of refinance activity last week, in line with the HARP share for the past few weeks.”
The average contract interest rate for 30-year fixed-rate mortgages with conforming loan balances ($417,500 or less) decreased to 3.74 percent, the lowest rate in the history of the survey, from 3.79 percent, with points increasing to 0.45 from 0.36 (including the origination fee) for 80 percent loan-to-value ratio (LTV) loans.
 Click on graph for larger image.
The first graph shows the purchase index, and the purchase index is mostly moving sideways over the last two years - but has been moving a little recently.
The second graph shows the refinance index.
 This index is back to the high for the year.
Some of the increase in the refinance index is related to HARP (HARP activity has picked up this year), but most of this activity is related to the record low mortgage rates.
Tuesday, July 17, 2012
Wednesday: Housing Starts, Beige Book, more Bernanke
by Calculated Risk on 7/17/2012 10:01:00 PM
Wednesday will be another busy day for economic data, but first from Binyamin Appelbaum at the NY Times: Cautious on Growth, Bernanke Offers No Hint of New Action
The Federal Reserve chairman, Ben S. Bernanke, said Tuesday that the Fed was seeking greater clarity about the health of the recovery, suggesting that officials were not ready to approve another round of stimulus.• At 7:00 AM AM ET, the Mortgage Bankers Association (MBA) will release the mortgage purchase applications index.
...
Rather than committing to new steps, Mr. Bernanke told the Senate Banking Committee that the decision would turn on the judgment of Fed officials about the pace of job growth in the coming months.
The major issue, he said, is “whether or not there is in fact a sustained recovery going on in the labor market, or are we stuck in the mud?” Mr. Bernanke added a wrinkle, saying the central bank “would certainly want to react against any increase in deflation risk.”
• 8:30 AM: Housing Starts for June will be released. The consensus is for total housing starts to increase to 745,000 (SAAR) in June from 708,000 in May.
• At 10:00 AM, Fed Chairman Ben Bernanke will testify before the Committee on Financial Services, U.S. House of Representatives. (same report again).
• At 2:00 PM, the Federal Reserve Beige Book will be released.
Also during the day, the AIA's Architecture Billings Index for June will be released (a leading indicator for commercial real estate).
For the July contest:


