 RSS Feed
 by Calculated Risk on 11/14/2011 09:16:00 PM
Monday, November 14, 2011
State by state exports to Europe
From the Miami Herald: Florida’s economy faces ‘moderate’ risk from European recession
Florida would fare better than many states should Europe slip into recession, a new study [by Wells Fargo] found. ... The report makes no mention of another key concern for Florida: European tourism. The United Kingdom is Florida’s second largest source of international travelers behind Canada, with Germany holding the fifth slot behind Brazil and Mexico.Here is a map from the referenced report by economist Mark Vitner and Michael Brown at Wells Fargo. The map shows European exports as a percent of state GDP.
 Click on graph for larger image.
Utah has a very high percentage of exports to Europe - mostly silver and gold to the United Kingdom. West Virginia exports coal.
As the Miami Herald article notes, Florida will probably also be impacted by less tourism too.
However the largest potential impact is probably from financial contagion as opposed to trade and tourism. Catherine Rampell has a summary of the various channels of contagion: The Euro Zone Crisis and the U.S.: A Primer
Schedule Update: MBA's 3rd Quarter 2011 National Delinquency Survey will be released Thursday
by Calculated Risk on 11/14/2011 06:31:00 PM
An update to the weekly schedule ...
10:00 AM: Mortgage Bankers Association (MBA) 3rd Quarter 2011 National Delinquency Survey (NDS)
The following graph shows the percent of loans delinquent by days past due for Q2.
The MBA reported 8.44% of mortgage loans were delinquent at the end of Q2, seasonally adjusted, and another 4.43% were in the foreclosure process (total of 12.87%, essentially unchanged from Q1).
 Click on graph for larger image.
This graph shows the percent of loans delinquent by days past due in Q2. Based on other data, the delinquency rate probably decreased slightly in Q3.
However the key problem is the large number of seriously delinquent loans (90+ days and in the foreclosure process). And there probably was little change in those percentages in Q3.
SF Fed: Recession odds in 2012 are greater than 50% due to European Crisis
by Calculated Risk on 11/14/2011 03:37:00 PM
An economic letter from the SF Fed: Future Recession Risks: An Update(ht Rickkk)
Gathering storms across the Atlantic threaten a U.S. economy not yet recovered from the last recession. ... In the next few months, the odds of recession due to domestic factors appear reasonably contained. ... However, the curve reflecting the international odds suggests more imminent danger to the economy, although this threat is harder to calibrate using historical data and only indirectly reflects the health of the European financial system. Recession odds based on international factors peak at about 45% toward the end of 2011 ... The combination of these two recession coins, shown in the combined risks line of Figure 2, is quite disconcerting. It indicates that the odds are greater than 50% that we will experience a recession sometime early in 2012. Because the international odds of recession are more imprecisely estimated, one must be careful with a strict interpretation of this result. But the message is clear. Prudence suggests that the fragile state of the U.S. economy would not easily withstand turbulence coming across the Atlantic.Based on domestic data, I think a recession is unlikely. However the European crisis is definitely a significant downside risk to U.S. economic growth. The spillover from Europe depends on how the crisis unfolds ...
Europe: Italian and Spanish bond yields rising
by Calculated Risk on 11/14/2011 01:24:00 PM
The Italian 10 year bond yield is up to 6.7%.
And keep an eye on Spain ... The Spanish 10 year bond yield has increased to 6.1%. The Spanish 2 year yield is up to 5.0%
From Bloomberg: Merkel’s CDU Delegates at Party Gathering Support Allowing Exits From Euro
“We’re not throwing anybody out,” Finance Minister Wolfgang Schaeuble said in an interview from Leipzig with broadcaster Phoenix. “We want Greece to stay in, that everybody stays in,” he said. “But if a country can’t carry the burden or doesn’t want to carry the burden, and the Greek people have to carry a heavy load, then we have to respect the country’s decision.”Earlier today, the Greek New Democracy opposition leader Antonis Samaras was quoted as saying his party would not vote for any austerity measures, and he would not sign any letter pledging a commitment to austerity measures. If so, Greece will probably be leaving the euro sooner rather than later.
LPS: House Price Index Shows 3.8 Percent Year-Over-Year Decline in August
by Calculated Risk on 11/14/2011 09:47:00 AM
Another house price index ...
The LPS HPI is a repeat sales index that uses public disclosure by county recorders or loan origination data for purchase loans (if the sales price isn't disclosed).
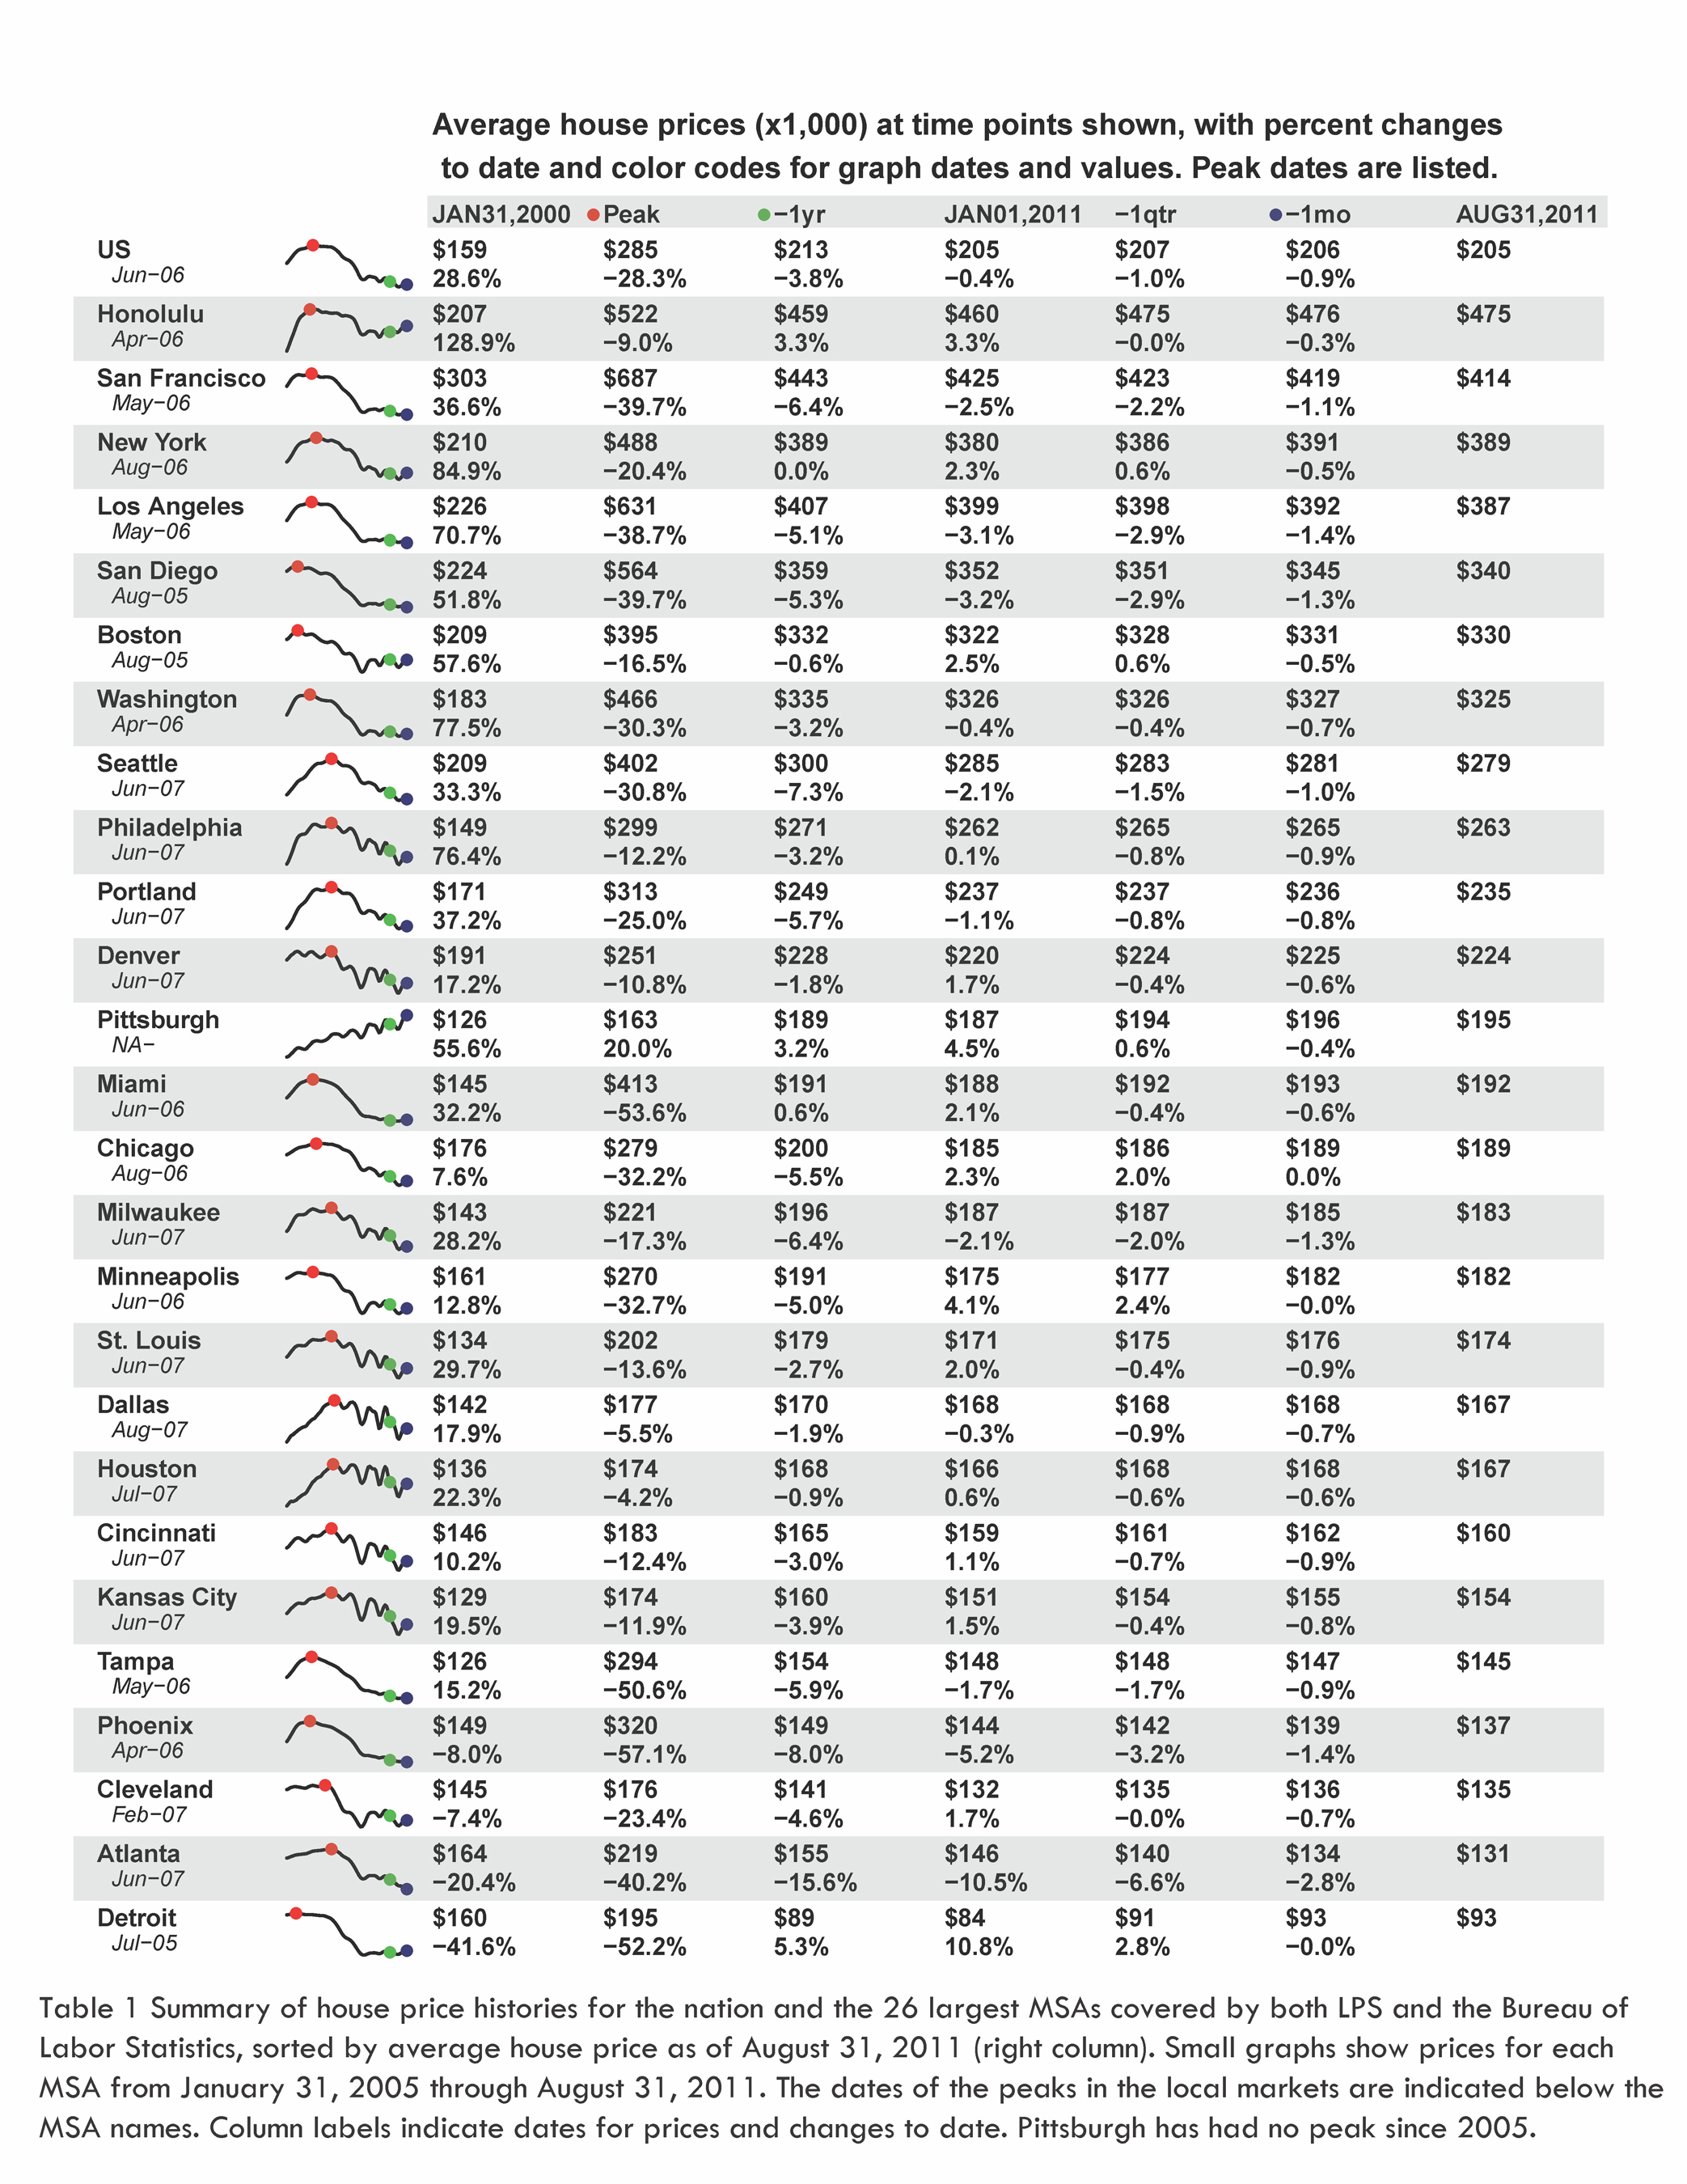
From LPS: Lender Processing Services’ Home Price Index Shows 3.8 Percent Year-Over-Year Decline in U.S. Home Prices in August; Nearly 30 Percent Off Market Peak
“In August sales transactions data, we saw the national average home price decline 0.9 percent, following a decline of 0.4 percent in July. This ended a series of increases during the spring of this year; a pattern that has occurred each year since 2009. In addition, the early, partial data for September sales indicates a likely further decline of approximately 1.1 percent to come. As of the end of August, the national average home price was $205,000. This is down 3.8 percent from August last year, and down 0.4 percent from January 1, 2011.”
 Click on graph for larger image.
 Home prices in August continued the downward trend begun after the market peak in June 2006. The LPS HPI average national home price has declined 28.3 percent since then. The total value of U.S. housing inventory covered by the LPS HPI stood at $10.6 trillion at the peak. As of the end of August 2011, it was $7.65 trillion. During the period of most rapid price changes, from July 31, 2007, through December, 2009, prices declined $56,000 from $282,000. The average annual decline during that time was 13.8 percent.In 2005 - at the peak of the bubble - most reporting focused on NAR median house prices. However median prices can be distorted by the mix of homes sold. The most followed repeat sales price index in 2005 was the OFHEO HPI (now FHFA), but that index was only for the GSEs - and missed the worst loans. The Case-Shiller index didn't become widely followed until 2007, and now we have a number of house price indexes!
Since December 2009, prices have fallen more slowly, interrupted by brief seasonal intervals of rising prices. Since then, the LPS HPI national average home price has fallen $20,000 from $225,000. This corresponds to an average annual decline of 3.6 percent.
...
Average prices declined during August in all but three of the 26 largest MSAs in the country that both the LPS HPI and Bureau of Labor Statistics’ economic data cover: Chicago, Detroit and Minneapolis remained essentially unchanged. Changes ranged from -0.3 percent in Honolulu to -2.8 percent in Atlanta (Table 1).
It appears all of the indexes will show new post-bubble lows later this year - or early in 2012.


